
Advertisement

Howard Marks put it nicely when he said that, rather than worrying about share price volatility, 'The possibility of permanent loss is the risk I worry about... and every practical investor I know worries about.' So it might be obvious that you need to consider debt, when you think about how risky any given stock is, because too much debt can sink a company. As with many other companies Tech Mahindra Limited (NSE:TECHM) makes use of debt. But the real question is whether this debt is making the company risky.
What Risk Does Debt Bring?
Debt is a tool to help businesses grow, but if a business is incapable of paying off its lenders, then it exists at their mercy. Part and parcel of capitalism is the process of 'creative destruction' where failed businesses are mercilessly liquidated by their bankers. However, a more frequent (but still costly) occurrence is where a company must issue shares at bargain-basement prices, permanently diluting shareholders, just to shore up its balance sheet. Having said that, the most common situation is where a company manages its debt reasonably well - and to its own advantage. The first step when considering a company's debt levels is to consider its cash and debt together.
Check out our latest analysis for Tech Mahindra
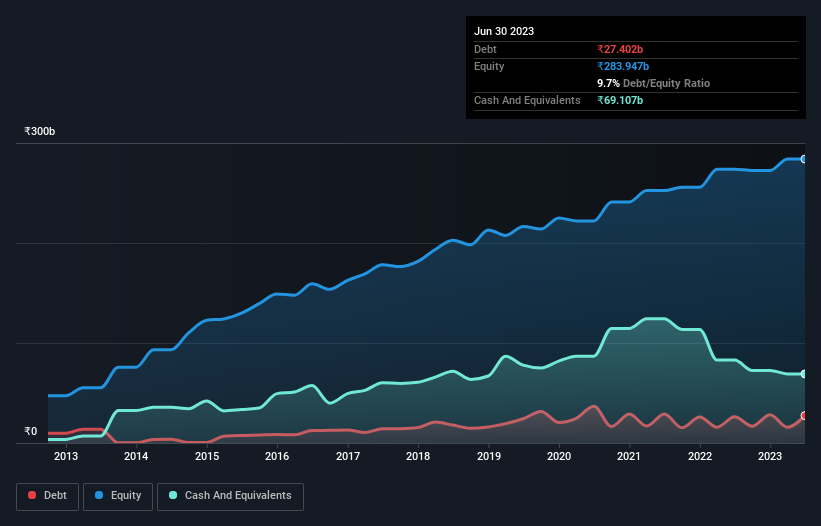
How Much Debt Does Tech Mahindra Carry?
As you can see below, at the end of March 2023, Tech Mahindra had ₹27.4b of debt, up from ₹26.2b a year ago. Click the image for more detail. But on the other hand it also has ₹69.1b in cash, leading to a ₹41.7b net cash position.
A Look At Tech Mahindra's Liabilities
We can see from the most recent balance sheet that Tech Mahindra had liabilities of ₹133.2b falling due within a year, and liabilities of ₹44.4b due beyond that. Offsetting this, it had ₹69.1b in cash and ₹147.1b in receivables that were due within 12 months. So it can boast ₹38.7b more liquid assets than total liabilities.
This short term liquidity is a sign that Tech Mahindra could probably pay off its debt with ease, as its balance sheet is far from stretched. Simply put, the fact that Tech Mahindra has more cash than debt is arguably a good indication that it can manage its debt safely.
On the other hand, Tech Mahindra's EBIT dived 13%, over the last year. We think hat kind of performance, if repeated frequently, could well lead to difficulties for the stock. The balance sheet is clearly the area to focus on when you are analysing debt. But ultimately the future profitability of the business will decide if Tech Mahindra can strengthen its balance sheet over time. So if you want to see what the professionals think, you might find this free report on analyst profit forecasts to be interesting.
Finally, a business needs free cash flow to pay off debt; accounting profits just don't cut it. While Tech Mahindra has net cash on its balance sheet, it's still worth taking a look at its ability to convert earnings before interest and tax (EBIT) to free cash flow, to help us understand how quickly it is building (or eroding) that cash balance. Over the last three years, Tech Mahindra recorded free cash flow worth a fulsome 86% of its EBIT, which is stronger than we'd usually expect. That positions it well to pay down debt if desirable to do so.
Summing Up
While it is always sensible to investigate a company's debt, in this case Tech Mahindra has ₹41.7b in net cash and a decent-looking balance sheet. And it impressed us with free cash flow of ₹46b, being 86% of its EBIT. So is Tech Mahindra's debt a risk? It doesn't seem so to us. The balance sheet is clearly the area to focus on when you are analysing debt. However, not all investment risk resides within the balance sheet - far from it. We've identified 1 warning sign with Tech Mahindra , and understanding them should be part of your investment process.
Of course, if you're the type of investor who prefers buying stocks without the burden of debt, then don't hesitate to discover our exclusive list of net cash growth stocks, today.
Valuation is complex, but we're here to simplify it.
Discover if Tech Mahindra might be undervalued or overvalued with our detailed analysis, featuring fair value estimates, potential risks, dividends, insider trades, and its financial condition.
Access Free AnalysisHave feedback on this article? Concerned about the content? Get in touch with us directly. Alternatively, email editorial-team (at) simplywallst.com.
This article by Simply Wall St is general in nature. We provide commentary based on historical data and analyst forecasts only using an unbiased methodology and our articles are not intended to be financial advice. It does not constitute a recommendation to buy or sell any stock, and does not take account of your objectives, or your financial situation. We aim to bring you long-term focused analysis driven by fundamental data. Note that our analysis may not factor in the latest price-sensitive company announcements or qualitative material. Simply Wall St has no position in any stocks mentioned.
About NSEI:TECHM
Tech Mahindra
Provides information technology services and solutions in the Americas, Europe, India, and internationally.
Flawless balance sheet with proven track record and pays a dividend.
Similar Companies
Market Insights

Advertisement
Community Narratives
Groundbreaking therapies that could change the treatment landscape for PTSD, fibromyalgia, MS & Alzheimer’s
Fair Value US$6.20|86.9% undervalued
CM
Community Contributor
DigitalOcean Will Grow 14% by Embracing AI with Paperspace Acquisition
Fair Value US$50.00|41.7% undervalued
NE
Community Contributor
Viant Technology: A Rising AdTech Challenger in the AI-Powered CTV Market
Fair Value US$38.61|63.2% undervalued
BL
Community Contributor
Volvo will Accelerate Forward into Electric and Autonomous Leadership in Five Years
Fair Value SEK 438.80|39.7% undervalued
UN
Community Contributor