
Advertisement
Legendary fund manager Li Lu (who Charlie Munger backed) once said, 'The biggest investment risk is not the volatility of prices, but whether you will suffer a permanent loss of capital.' When we think about how risky a company is, we always like to look at its use of debt, since debt overload can lead to ruin. We can see that NIIT Limited (NSE:NIITLTD) does use debt in its business. But is this debt a concern to shareholders?
Why Does Debt Bring Risk?
Debt assists a business until the business has trouble paying it off, either with new capital or with free cash flow. In the worst case scenario, a company can go bankrupt if it cannot pay its creditors. However, a more usual (but still expensive) situation is where a company must dilute shareholders at a cheap share price simply to get debt under control. Of course, the upside of debt is that it often represents cheap capital, especially when it replaces dilution in a company with the ability to reinvest at high rates of return. When we think about a company's use of debt, we first look at cash and debt together.
View our latest analysis for NIIT
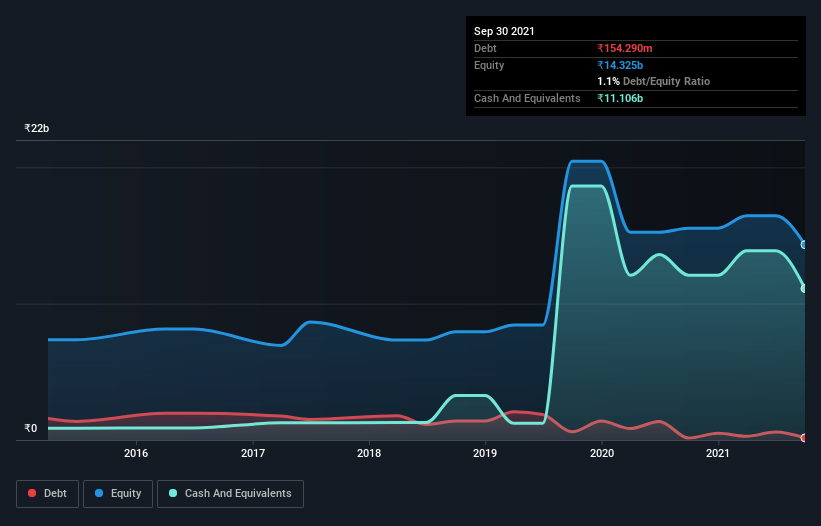
What Is NIIT's Net Debt?
As you can see below, at the end of September 2021, NIIT had ₹154.3m of debt, up from ₹137.9m a year ago. Click the image for more detail. However, its balance sheet shows it holds ₹11.1b in cash, so it actually has ₹11.0b net cash.
A Look At NIIT's Liabilities
The latest balance sheet data shows that NIIT had liabilities of ₹4.87b due within a year, and liabilities of ₹146.2m falling due after that. On the other hand, it had cash of ₹11.1b and ₹1.78b worth of receivables due within a year. So it actually has ₹7.86b more liquid assets than total liabilities.
This short term liquidity is a sign that NIIT could probably pay off its debt with ease, as its balance sheet is far from stretched. Simply put, the fact that NIIT has more cash than debt is arguably a good indication that it can manage its debt safely.
Even more impressive was the fact that NIIT grew its EBIT by 858% over twelve months. If maintained that growth will make the debt even more manageable in the years ahead. The balance sheet is clearly the area to focus on when you are analysing debt. But ultimately the future profitability of the business will decide if NIIT can strengthen its balance sheet over time. So if you're focused on the future you can check out this free report showing analyst profit forecasts.
Finally, while the tax-man may adore accounting profits, lenders only accept cold hard cash. While NIIT has net cash on its balance sheet, it's still worth taking a look at its ability to convert earnings before interest and tax (EBIT) to free cash flow, to help us understand how quickly it is building (or eroding) that cash balance. Happily for any shareholders, NIIT actually produced more free cash flow than EBIT over the last three years. That sort of strong cash conversion gets us as excited as the crowd when the beat drops at a Daft Punk concert.
Summing up
While we empathize with investors who find debt concerning, you should keep in mind that NIIT has net cash of ₹11.0b, as well as more liquid assets than liabilities. The cherry on top was that in converted 115% of that EBIT to free cash flow, bringing in ₹2.6b. So is NIIT's debt a risk? It doesn't seem so to us. When analysing debt levels, the balance sheet is the obvious place to start. But ultimately, every company can contain risks that exist outside of the balance sheet. Be aware that NIIT is showing 4 warning signs in our investment analysis , you should know about...
At the end of the day, it's often better to focus on companies that are free from net debt. You can access our special list of such companies (all with a track record of profit growth). It's free.
Valuation is complex, but we're here to simplify it.
Discover if NIIT might be undervalued or overvalued with our detailed analysis, featuring fair value estimates, potential risks, dividends, insider trades, and its financial condition.
Access Free AnalysisHave feedback on this article? Concerned about the content? Get in touch with us directly. Alternatively, email editorial-team (at) simplywallst.com.
This article by Simply Wall St is general in nature. We provide commentary based on historical data and analyst forecasts only using an unbiased methodology and our articles are not intended to be financial advice. It does not constitute a recommendation to buy or sell any stock, and does not take account of your objectives, or your financial situation. We aim to bring you long-term focused analysis driven by fundamental data. Note that our analysis may not factor in the latest price-sensitive company announcements or qualitative material. Simply Wall St has no position in any stocks mentioned.
About NSEI:NIITLTD
NIIT
Engages in providing learning and knowledge solutions to individuals, enterprises, and various institutions internationally.
Excellent balance sheet with reasonable growth potential.
Market Insights

Advertisement
Weekly Picks
RO


RockeTeller on Santacruz Silver Mining ·
Crazy Undervalued 42 Baggers Silver Play (Active & Running Mine)
Fair Value:CA$8696.7% undervalued
55 followersusers have followed this narrative
6 commentsusers have commented on this narrative
17 likesusers have liked this narrative
RO


Robbo on Fiducian Group ·
Fiducian: Compliance Clouds or Value Opportunity?
Fair Value:AU$122.0% undervalued
9 followersusers have followed this narrative
0 commentsusers have commented on this narrative
0 likesusers have liked this narrative
WO

woodworthfund on Willamette Valley Vineyards ·
Willamette Valley Vineyards (WVVI): Not-So-Great Value
Fair Value:US$242.5% overvalued
10 followersusers have followed this narrative
0 commentsusers have commented on this narrative
1 likeusers have liked this narrative
Recently Updated Narratives
DA


davidlsander on Beam Therapeutics ·
The "Molecular Pencil": Why Beam's Technology is Built to Win
Fair Value:US$15081.9% undervalued
49 followersusers have followed this narrative
3 commentsusers have commented on this narrative
1 likeusers have liked this narrative
MO


mo7md on ADNOC Gas ·
ADNOC Gas future shines with a 21.4% revenue surge
Fair Value:د.إ3.728.9% undervalued
2 followersusers have followed this narrative
0 commentsusers have commented on this narrative
0 likesusers have liked this narrative
IN

IncomeAssets on Pulse Seismic ·
Watch Pulse Seismic Outperform with 13.6% Revenue Growth in the Coming Years
Fair Value:CA$4.4727.3% undervalued
5 followersusers have followed this narrative
0 commentsusers have commented on this narrative
0 likesusers have liked this narrative
Popular Narratives
TH


TheWallstreetKing on MicroVision ·
MicroVision will explode future revenue by 380.37% with a vision towards success
Fair Value:US$6098.5% undervalued
116 followersusers have followed this narrative
11 commentsusers have commented on this narrative
22 likesusers have liked this narrative
AN


AnalystConsensusTarget on NVIDIA ·
NVDA: Expanding AI Demand Will Drive Major Data Center Investments Through 2026
Fair Value:US$250.3927.2% undervalued
957 followersusers have followed this narrative
6 commentsusers have commented on this narrative
25 likesusers have liked this narrative
RO
RockeTeller on Santacruz Silver Mining ·
Crazy Undervalued 42 Baggers Silver Play (Active & Running Mine)
Fair Value:CA$8696.7% undervalued
55 followersusers have followed this narrative
6 commentsusers have commented on this narrative
17 likesusers have liked this narrative

