
Advertisement

Many investors are still learning about the various metrics that can be useful when analysing a stock. This article is for those who would like to learn about Return On Equity (ROE). By way of learning-by-doing, we'll look at ROE to gain a better understanding of NIIT Limited (NSE:NIITLTD).
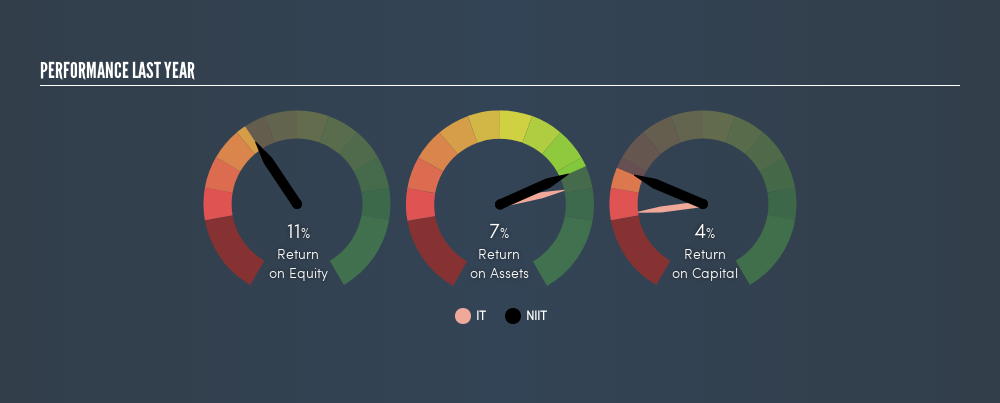
Our data shows NIIT has a return on equity of 11% for the last year. That means that for every ₹1 worth of shareholders' equity, it generated ₹0.11 in profit.
See our latest analysis for NIIT
How Do You Calculate Return On Equity?
The formula for ROE is:
Return on Equity = Net Profit ÷ Shareholders' Equity
Or for NIIT:
11% = ₹829m ÷ ₹7.9b (Based on the trailing twelve months to December 2018.)
Most know that net profit is the total earnings after all expenses, but the concept of shareholders' equity is a little more complicated. It is all the money paid into the company from shareholders, plus any earnings retained. The easiest way to calculate shareholders' equity is to subtract the company's total liabilities from the total assets.
What Does ROE Mean?
ROE measures a company's profitability against the profit it retains, and any outside investments. The 'return' is the profit over the last twelve months. The higher the ROE, the more profit the company is making. So, all else equal, investors should like a high ROE. Clearly, then, one can use ROE to compare different companies.
Does NIIT Have A Good ROE?
One simple way to determine if a company has a good return on equity is to compare it to the average for its industry. Importantly, this is far from a perfect measure, because companies differ significantly within the same industry classification. The image below shows that NIIT has an ROE that is roughly in line with the IT industry average (11%).
That's neither particularly good, nor bad. ROE tells us about the quality of the business, but it does not give us much of an idea if the share price is cheap. If you like to buy stocks alongside management, then you might just love this freelist of companies. (Hint: insiders have been buying them).
Why You Should Consider Debt When Looking At ROE
Virtually all companies need money to invest in the business, to grow profits. That cash can come from issuing shares, retained earnings, or debt. In the case of the first and second options, the ROE will reflect this use of cash, for growth. In the latter case, the debt required for growth will boost returns, but will not impact the shareholders' equity. Thus the use of debt can improve ROE, albeit along with extra risk in the case of stormy weather, metaphorically speaking.
Combining NIIT's Debt And Its 11% Return On Equity
Although NIIT does use debt, its debt to equity ratio of 0.18 is still low. I'm not impressed with its ROE, but the debt levels are not too high, indicating the business has decent prospects. Conservative use of debt to boost returns is usually a good move for shareholders, though it does leave the company more exposed to interest rate rises.
The Key Takeaway
Return on equity is one way we can compare the business quality of different companies. A company that can achieve a high return on equity without debt could be considered a high quality business. If two companies have the same ROE, then I would generally prefer the one with less debt.
But when a business is high quality, the market often bids it up to a price that reflects this. The rate at which profits are likely to grow, relative to the expectations of profit growth reflected in the current price, must be considered, too. So you might want to take a peek at this data-rich interactive graph of forecasts for the company.
Of course NIIT may not be the best stock to buy. So you may wish to see this free collection of other companies that have high ROE and low debt.
We aim to bring you long-term focused research analysis driven by fundamental data. Note that our analysis may not factor in the latest price-sensitive company announcements or qualitative material.
If you spot an error that warrants correction, please contact the editor at editorial-team@simplywallst.com. This article by Simply Wall St is general in nature. It does not constitute a recommendation to buy or sell any stock, and does not take account of your objectives, or your financial situation. Simply Wall St has no position in the stocks mentioned. Thank you for reading.
About NSEI:NIITLTD
NIIT
Engages in providing learning and knowledge solutions to individuals, enterprises, and various institutions worldwide.
Excellent balance sheet with reasonable growth potential.
Market Insights


Advertisement
Community Narratives
For the Emperor: Why Games Workshop Could Be a Star Investment
Fair Value UK£160.00|0.4% overvalued
RO
Community Contributor
Securitas will boost margins with AI and tech-driven services
Fair Value SEK 260.91|44.5% undervalued
UN
Community Contributor
A Leader in EV Charging with Growth Potential
Fair Value €27.00|17.8% undervalued
TI
Community Contributor