Advertisement
The external fund manager backed by Berkshire Hathaway's Charlie Munger, Li Lu, makes no bones about it when he says 'The biggest investment risk is not the volatility of prices, but whether you will suffer a permanent loss of capital.' It's only natural to consider a company's balance sheet when you examine how risky it is, since debt is often involved when a business collapses. Importantly, Kellton Tech Solutions Limited (NSE:KELLTONTEC) does carry debt. But the real question is whether this debt is making the company risky.
Why Does Debt Bring Risk?
Debt assists a business until the business has trouble paying it off, either with new capital or with free cash flow. If things get really bad, the lenders can take control of the business. However, a more common (but still painful) scenario is that it has to raise new equity capital at a low price, thus permanently diluting shareholders. By replacing dilution, though, debt can be an extremely good tool for businesses that need capital to invest in growth at high rates of return. The first step when considering a company's debt levels is to consider its cash and debt together.
Check out our latest analysis for Kellton Tech Solutions
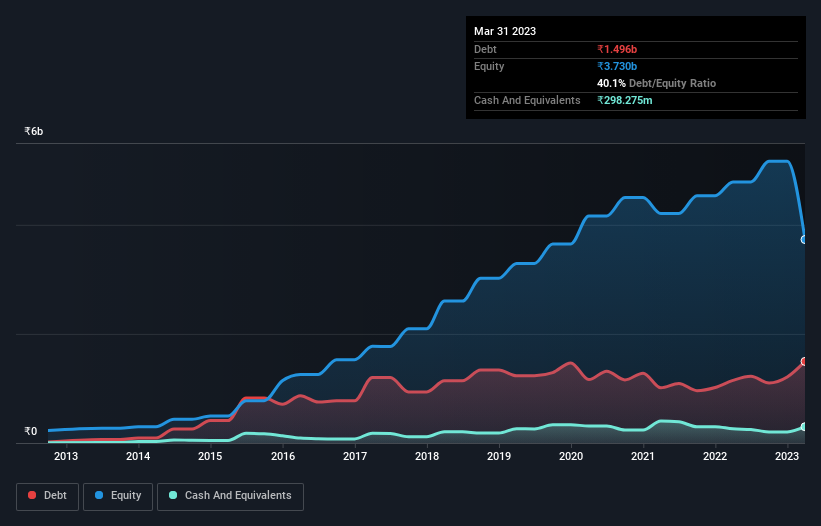
How Much Debt Does Kellton Tech Solutions Carry?
As you can see below, at the end of March 2023, Kellton Tech Solutions had ₹1.50b of debt, up from ₹1.15b a year ago. Click the image for more detail. On the flip side, it has ₹298.3m in cash leading to net debt of about ₹1.20b.
How Healthy Is Kellton Tech Solutions' Balance Sheet?
Zooming in on the latest balance sheet data, we can see that Kellton Tech Solutions had liabilities of ₹1.62b due within 12 months and liabilities of ₹618.8m due beyond that. On the other hand, it had cash of ₹298.3m and ₹2.61b worth of receivables due within a year. So it actually has ₹678.4m more liquid assets than total liabilities.
This short term liquidity is a sign that Kellton Tech Solutions could probably pay off its debt with ease, as its balance sheet is far from stretched.
We use two main ratios to inform us about debt levels relative to earnings. The first is net debt divided by earnings before interest, tax, depreciation, and amortization (EBITDA), while the second is how many times its earnings before interest and tax (EBIT) covers its interest expense (or its interest cover, for short). Thus we consider debt relative to earnings both with and without depreciation and amortization expenses.
While Kellton Tech Solutions's low debt to EBITDA ratio of 1.3 suggests only modest use of debt, the fact that EBIT only covered the interest expense by 6.9 times last year does give us pause. But the interest payments are certainly sufficient to have us thinking about how affordable its debt is. But the bad news is that Kellton Tech Solutions has seen its EBIT plunge 16% in the last twelve months. If that rate of decline in earnings continues, the company could find itself in a tight spot. There's no doubt that we learn most about debt from the balance sheet. But it is Kellton Tech Solutions's earnings that will influence how the balance sheet holds up in the future. So if you're keen to discover more about its earnings, it might be worth checking out this graph of its long term earnings trend.
Finally, a company can only pay off debt with cold hard cash, not accounting profits. So we clearly need to look at whether that EBIT is leading to corresponding free cash flow. Looking at the most recent three years, Kellton Tech Solutions recorded free cash flow of 24% of its EBIT, which is weaker than we'd expect. That weak cash conversion makes it more difficult to handle indebtedness.
Our View
Kellton Tech Solutions's EBIT growth rate was a real negative on this analysis, although the other factors we considered were considerably better. There's no doubt that it has an adequate capacity to handle its total liabilities. When we consider all the factors mentioned above, we do feel a bit cautious about Kellton Tech Solutions's use of debt. While we appreciate debt can enhance returns on equity, we'd suggest that shareholders keep close watch on its debt levels, lest they increase. When analysing debt levels, the balance sheet is the obvious place to start. But ultimately, every company can contain risks that exist outside of the balance sheet. For example Kellton Tech Solutions has 3 warning signs (and 1 which is potentially serious) we think you should know about.
If you're interested in investing in businesses that can grow profits without the burden of debt, then check out this free list of growing businesses that have net cash on the balance sheet.
Valuation is complex, but we're here to simplify it.
Discover if Kellton Tech Solutions might be undervalued or overvalued with our detailed analysis, featuring fair value estimates, potential risks, dividends, insider trades, and its financial condition.
Access Free AnalysisHave feedback on this article? Concerned about the content? Get in touch with us directly. Alternatively, email editorial-team (at) simplywallst.com.
This article by Simply Wall St is general in nature. We provide commentary based on historical data and analyst forecasts only using an unbiased methodology and our articles are not intended to be financial advice. It does not constitute a recommendation to buy or sell any stock, and does not take account of your objectives, or your financial situation. We aim to bring you long-term focused analysis driven by fundamental data. Note that our analysis may not factor in the latest price-sensitive company announcements or qualitative material. Simply Wall St has no position in any stocks mentioned.
About NSEI:KELLTONTEC
Kellton Tech Solutions
Engages in the provision of digital transformation, ERP, and other IT services in APAC, Europe, the United States, and internationally.
Proven track record with adequate balance sheet.
Market Insights


Advertisement
Weekly Picks
LO


Lou_Basenese on Virtuix Holdings ·
From a “Shark Tank” Snub to an Air Force “Yes”: Why Virtuix at $3.50 May Be the Market’s Most Mispriced AI Story
Fair Value:US$7.562.8% undervalued
22 followersusers have followed this narrative
0 commentsusers have commented on this narrative
3 likesusers have liked this narrative
IN


Investingwilly on Mastercard ·
Mastercard: The Best Dividend Stock You're Ignoring
Fair Value:US$75033.5% undervalued
72 followersusers have followed this narrative
1 commentusers have commented on this narrative
9 likesusers have liked this narrative
TR


tripledub on Intuit ·
A Wonderful Business at a Not-So-Wonderful Price
Fair Value:US$56052.2% undervalued
64 followersusers have followed this narrative
4 commentsusers have commented on this narrative
30 likesusers have liked this narrative
TA


Talos on MindWalk Holdings ·
The Asymmetric TechBio Play: MindWalk Holdings and the Valuation Disconnect
Fair Value:US$8.2780.9% undervalued
35 followersusers have followed this narrative
0 commentsusers have commented on this narrative
9 likesusers have liked this narrative
Recently Updated Narratives
RO


RockeTeller on Orezone Gold ·
Orezone Gold Could 3X–5X, Bomboré Ramp + Casa Berardi Quebec Asset Delivers 160-180Koz in 2026
Fair Value:CA$10.6878.4% undervalued
11 followersusers have followed this narrative
4 commentsusers have commented on this narrative
1 likeusers have liked this narrative
IV

Ivoed on Netflix ·
Netflix’s Business Quality Is Clear. The Harder Question Is Whether The Stock Is Still Cheap
Fair Value:US$8210.0% undervalued
4 followersusers have followed this narrative
0 commentsusers have commented on this narrative
0 likesusers have liked this narrative
RO

RockeTeller on NeXGold Mining ·
NexGold Mining: 4.7Moz M&I Resources, $100M Cash + Debt-Free, Construction Decision 2026 Undervalued Canadian Gold Developer
Fair Value:CA$39.5296.9% undervalued
5 followersusers have followed this narrative
3 commentsusers have commented on this narrative
1 likeusers have liked this narrative
Popular Narratives
IN
Investingwilly on Mastercard ·
Mastercard: The Best Dividend Stock You're Ignoring
Fair Value:US$75033.5% undervalued
72 followersusers have followed this narrative
1 commentusers have commented on this narrative
9 likesusers have liked this narrative
HA


HarishPK on Adobe ·
Adobe: A Probabilistic Case for Undervaluation
Fair Value:US$319.9636.6% undervalued
62 followersusers have followed this narrative
9 commentsusers have commented on this narrative
19 likesusers have liked this narrative
MA


martinarauz on Nu Holdings ·
Investment Analysis (May 2026)
Fair Value:US$22.7442.1% undervalued
68 followersusers have followed this narrative
0 commentsusers have commented on this narrative
17 likesusers have liked this narrative
