Advertisement
Kellton Tech Solutions (NSE:KELLTONTEC) Might Be Having Difficulty Using Its Capital Effectively
What trends should we look for it we want to identify stocks that can multiply in value over the long term? Typically, we'll want to notice a trend of growing return on capital employed (ROCE) and alongside that, an expanding base of capital employed. If you see this, it typically means it's a company with a great business model and plenty of profitable reinvestment opportunities. However, after investigating Kellton Tech Solutions (NSE:KELLTONTEC), we don't think it's current trends fit the mold of a multi-bagger.
Return On Capital Employed (ROCE): What Is It?
Just to clarify if you're unsure, ROCE is a metric for evaluating how much pre-tax income (in percentage terms) a company earns on the capital invested in its business. The formula for this calculation on Kellton Tech Solutions is:
Return on Capital Employed = Earnings Before Interest and Tax (EBIT) ÷ (Total Assets - Current Liabilities)
0.18 = ₹803m ÷ (₹6.0b - ₹1.6b) (Based on the trailing twelve months to June 2023).
Thus, Kellton Tech Solutions has an ROCE of 18%. On its own, that's a standard return, however it's much better than the 15% generated by the IT industry.
Check out our latest analysis for Kellton Tech Solutions
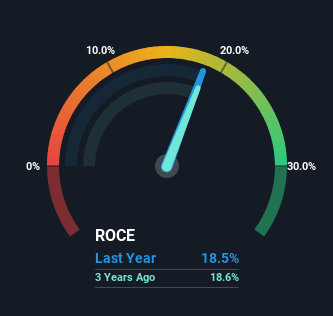
Historical performance is a great place to start when researching a stock so above you can see the gauge for Kellton Tech Solutions' ROCE against it's prior returns. If you want to delve into the historical earnings, revenue and cash flow of Kellton Tech Solutions, check out these free graphs here.
What Does the ROCE Trend For Kellton Tech Solutions Tell Us?
On the surface, the trend of ROCE at Kellton Tech Solutions doesn't inspire confidence. Over the last five years, returns on capital have decreased to 18% from 34% five years ago. However, given capital employed and revenue have both increased it appears that the business is currently pursuing growth, at the consequence of short term returns. And if the increased capital generates additional returns, the business, and thus shareholders, will benefit in the long run.
On a related note, Kellton Tech Solutions has decreased its current liabilities to 27% of total assets. That could partly explain why the ROCE has dropped. What's more, this can reduce some aspects of risk to the business because now the company's suppliers or short-term creditors are funding less of its operations. Some would claim this reduces the business' efficiency at generating ROCE since it is now funding more of the operations with its own money.
The Bottom Line
While returns have fallen for Kellton Tech Solutions in recent times, we're encouraged to see that sales are growing and that the business is reinvesting in its operations. And long term investors must be optimistic going forward because the stock has returned a huge 111% to shareholders in the last five years. So while the underlying trends could already be accounted for by investors, we still think this stock is worth looking into further.
One final note, you should learn about the 2 warning signs we've spotted with Kellton Tech Solutions (including 1 which is concerning) .
For those who like to invest in solid companies, check out this free list of companies with solid balance sheets and high returns on equity.
Valuation is complex, but we're here to simplify it.
Discover if Kellton Tech Solutions might be undervalued or overvalued with our detailed analysis, featuring fair value estimates, potential risks, dividends, insider trades, and its financial condition.
Access Free AnalysisHave feedback on this article? Concerned about the content? Get in touch with us directly. Alternatively, email editorial-team (at) simplywallst.com.
This article by Simply Wall St is general in nature. We provide commentary based on historical data and analyst forecasts only using an unbiased methodology and our articles are not intended to be financial advice. It does not constitute a recommendation to buy or sell any stock, and does not take account of your objectives, or your financial situation. We aim to bring you long-term focused analysis driven by fundamental data. Note that our analysis may not factor in the latest price-sensitive company announcements or qualitative material. Simply Wall St has no position in any stocks mentioned.
About NSEI:KELLTONTEC
Kellton Tech Solutions
Engages in the provision of digital transformation, ERP, and other IT services in APAC, Europe, the United States, and internationally.
Proven track record with adequate balance sheet.
Market Insights


Advertisement
Weekly Picks
LO


Lou_Basenese on Virtuix Holdings ·
From a “Shark Tank” Snub to an Air Force “Yes”: Why Virtuix at $3.50 May Be the Market’s Most Mispriced AI Story
Fair Value:US$7.562.8% undervalued
28 followersusers have followed this narrative
0 commentsusers have commented on this narrative
5 likesusers have liked this narrative
IN


Investingwilly on Mastercard ·
Mastercard: The Best Dividend Stock You're Ignoring
Fair Value:US$75033.5% undervalued
75 followersusers have followed this narrative
1 commentusers have commented on this narrative
9 likesusers have liked this narrative
TR


tripledub on Intuit ·
A Wonderful Business at a Not-So-Wonderful Price
Fair Value:US$56052.2% undervalued
66 followersusers have followed this narrative
4 commentsusers have commented on this narrative
30 likesusers have liked this narrative
TA


Talos on MindWalk Holdings ·
The Asymmetric TechBio Play: MindWalk Holdings and the Valuation Disconnect
Fair Value:US$8.2780.9% undervalued
36 followersusers have followed this narrative
0 commentsusers have commented on this narrative
9 likesusers have liked this narrative
Recently Updated Narratives
RO


RockeTeller on Abitibi Metals ·
Abitibi Metals’ High-Grade B26 Polymetallic Deposit Trading at a Fraction of Peers, 96% Undervalued?
Fair Value:CA$1.2950.4% undervalued
3 followersusers have followed this narrative
0 commentsusers have commented on this narrative
1 likeusers have liked this narrative
EV

everyseed on Zylox-Tonbridge Medical Technology ·
Zylox-Tonbridge: Early Signs of an Emerging Global Vascular Intervention Platform
Fair Value:HK$30.8539.9% undervalued
1 followerusers have followed this narrative
0 commentsusers have commented on this narrative
0 likesusers have liked this narrative
AN

Anthony_Lee on Geohan Corporation Berhad ·
Geohan's Growth Outlook Brightens on Expanding Order Book and Easing Cost Pressures
Fair Value:RM 0.7460.8% undervalued
2 followersusers have followed this narrative
0 commentsusers have commented on this narrative
0 likesusers have liked this narrative
Popular Narratives
IN
Investingwilly on Mastercard ·
Mastercard: The Best Dividend Stock You're Ignoring
Fair Value:US$75033.5% undervalued
75 followersusers have followed this narrative
1 commentusers have commented on this narrative
9 likesusers have liked this narrative
HA


HarishPK on Adobe ·
Adobe: A Probabilistic Case for Undervaluation
Fair Value:US$319.9636.6% undervalued
62 followersusers have followed this narrative
9 commentsusers have commented on this narrative
19 likesusers have liked this narrative
MA


martinarauz on Nu Holdings ·
Investment Analysis (May 2026)
Fair Value:US$22.7442.1% undervalued
68 followersusers have followed this narrative
0 commentsusers have commented on this narrative
17 likesusers have liked this narrative
