
Advertisement
Cambridge Technology Enterprises Limited's (NSE:CTE) Stock is Soaring But Financials Seem Inconsistent: Will The Uptrend Continue?
Cambridge Technology Enterprises' (NSE:CTE) stock is up by a considerable 22% over the past three months. But the company's key financial indicators appear to be differing across the board and that makes us question whether or not the company's current share price momentum can be maintained. Specifically, we decided to study Cambridge Technology Enterprises' ROE in this article.
Return on equity or ROE is a key measure used to assess how efficiently a company's management is utilizing the company's capital. In other words, it is a profitability ratio which measures the rate of return on the capital provided by the company's shareholders.
Check out our latest analysis for Cambridge Technology Enterprises
How To Calculate Return On Equity?
The formula for ROE is:
Return on Equity = Net Profit (from continuing operations) ÷ Shareholders' Equity
So, based on the above formula, the ROE for Cambridge Technology Enterprises is:
0.7% = ₹6.6m ÷ ₹992m (Based on the trailing twelve months to December 2023).
The 'return' is the profit over the last twelve months. One way to conceptualize this is that for each ₹1 of shareholders' capital it has, the company made ₹0.01 in profit.
What Has ROE Got To Do With Earnings Growth?
We have already established that ROE serves as an efficient profit-generating gauge for a company's future earnings. Based on how much of its profits the company chooses to reinvest or "retain", we are then able to evaluate a company's future ability to generate profits. Assuming everything else remains unchanged, the higher the ROE and profit retention, the higher the growth rate of a company compared to companies that don't necessarily bear these characteristics.
Cambridge Technology Enterprises' Earnings Growth And 0.7% ROE
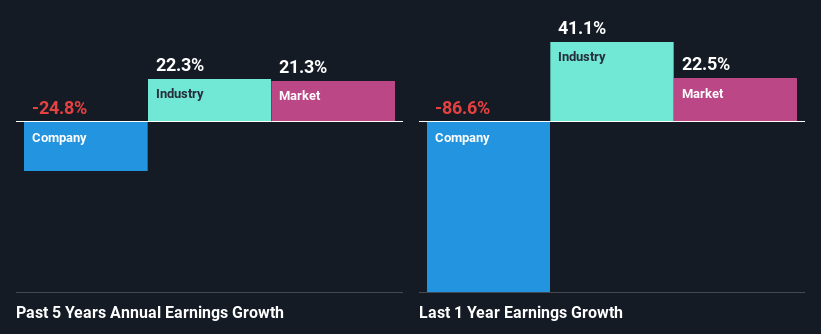
It is hard to argue that Cambridge Technology Enterprises' ROE is much good in and of itself. Even when compared to the industry average of 16%, the ROE figure is pretty disappointing. Given the circumstances, the significant decline in net income by 25% seen by Cambridge Technology Enterprises over the last five years is not surprising. However, there could also be other factors causing the earnings to decline. For instance, the company has a very high payout ratio, or is faced with competitive pressures.
However, when we compared Cambridge Technology Enterprises' growth with the industry we found that while the company's earnings have been shrinking, the industry has seen an earnings growth of 22% in the same period. This is quite worrisome.
Earnings growth is a huge factor in stock valuation. It’s important for an investor to know whether the market has priced in the company's expected earnings growth (or decline). By doing so, they will have an idea if the stock is headed into clear blue waters or if swampy waters await. One good indicator of expected earnings growth is the P/E ratio which determines the price the market is willing to pay for a stock based on its earnings prospects. So, you may want to check if Cambridge Technology Enterprises is trading on a high P/E or a low P/E, relative to its industry.
Is Cambridge Technology Enterprises Efficiently Re-investing Its Profits?
Cambridge Technology Enterprises doesn't pay any regular dividends, meaning that potentially all of its profits are being reinvested in the business, which doesn't explain why the company's earnings have shrunk if it is retaining all of its profits. So there could be some other explanations in that regard. For instance, the company's business may be deteriorating.
Conclusion
In total, we're a bit ambivalent about Cambridge Technology Enterprises' performance. While the company does have a high rate of profit retention, its low rate of return is probably hampering its earnings growth. Wrapping up, we would proceed with caution with this company and one way of doing that would be to look at the risk profile of the business. Our risks dashboard would have the 4 risks we have identified for Cambridge Technology Enterprises.
New: AI Stock Screener & Alerts
Our new AI Stock Screener scans the market every day to uncover opportunities.
• Dividend Powerhouses (3%+ Yield)
• Undervalued Small Caps with Insider Buying
• High growth Tech and AI Companies
Or build your own from over 50 metrics.
Have feedback on this article? Concerned about the content? Get in touch with us directly. Alternatively, email editorial-team (at) simplywallst.com.
This article by Simply Wall St is general in nature. We provide commentary based on historical data and analyst forecasts only using an unbiased methodology and our articles are not intended to be financial advice. It does not constitute a recommendation to buy or sell any stock, and does not take account of your objectives, or your financial situation. We aim to bring you long-term focused analysis driven by fundamental data. Note that our analysis may not factor in the latest price-sensitive company announcements or qualitative material. Simply Wall St has no position in any stocks mentioned.
About NSEI:CTE
Cambridge Technology Enterprises
A business and technology services company, provides IT solutions to enterprise services in India, the United States, the Middle East, and internationally.
Good value with slight risk.
Similar Companies
Market Insights

Advertisement
Community Narratives
Finding The True Value Of A Logistics Powerhouse
Fair Value US$95.21|8.4% undervalued
NV
Community Contributor
Paradigm Biopharmaceuticals Will Lead Osteoarthritis Treatment with Zilosul's FDA Success
Fair Value AU$5.50|92.1% undervalued
AM
Community Contributor
Barrick Mining (ABX:CA): A Gold Hedge against a U.S. Shutdown
Fair Value CA$60.00|24.2% undervalued
GM
Community Contributor