- India
- /
- General Merchandise and Department Stores
- /
- NSEI:VMART
Is V-Mart Retail (NSE:VMART) A Risky Investment?


The external fund manager backed by Berkshire Hathaway's Charlie Munger, Li Lu, makes no bones about it when he says 'The biggest investment risk is not the volatility of prices, but whether you will suffer a permanent loss of capital.' So it might be obvious that you need to consider debt, when you think about how risky any given stock is, because too much debt can sink a company. As with many other companies V-Mart Retail Limited (NSE:VMART) makes use of debt. But the more important question is: how much risk is that debt creating?
When Is Debt Dangerous?
Debt is a tool to help businesses grow, but if a business is incapable of paying off its lenders, then it exists at their mercy. Part and parcel of capitalism is the process of 'creative destruction' where failed businesses are mercilessly liquidated by their bankers. However, a more frequent (but still costly) occurrence is where a company must issue shares at bargain-basement prices, permanently diluting shareholders, just to shore up its balance sheet. By replacing dilution, though, debt can be an extremely good tool for businesses that need capital to invest in growth at high rates of return. When we examine debt levels, we first consider both cash and debt levels, together.
View our latest analysis for V-Mart Retail
What Is V-Mart Retail's Net Debt?
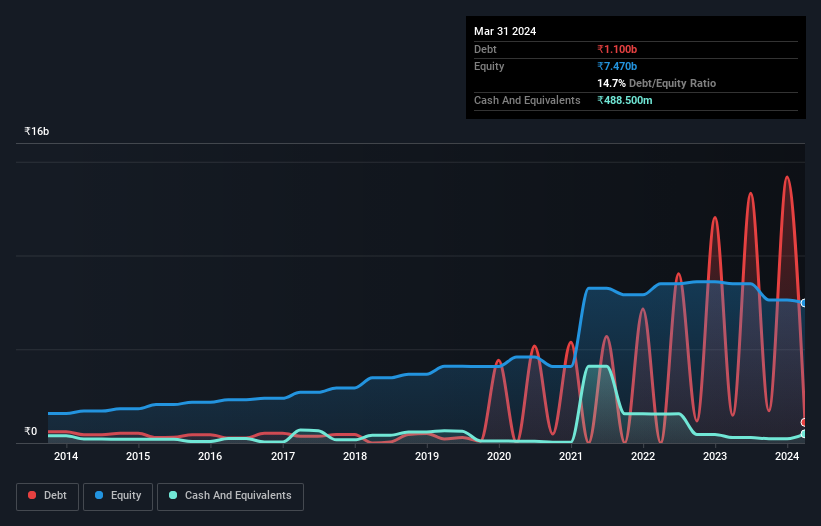
The image below, which you can click on for greater detail, shows that V-Mart Retail had debt of ₹1.10b at the end of March 2024, a reduction from ₹1.48b over a year. However, it does have ₹488.5m in cash offsetting this, leading to net debt of about ₹611.8m.
How Healthy Is V-Mart Retail's Balance Sheet?
We can see from the most recent balance sheet that V-Mart Retail had liabilities of ₹8.92b falling due within a year, and liabilities of ₹12.1b due beyond that. Offsetting this, it had ₹488.5m in cash and ₹209.8m in receivables that were due within 12 months. So its liabilities outweigh the sum of its cash and (near-term) receivables by ₹20.3b.
While this might seem like a lot, it is not so bad since V-Mart Retail has a market capitalization of ₹69.0b, and so it could probably strengthen its balance sheet by raising capital if it needed to. However, it is still worthwhile taking a close look at its ability to pay off debt. But either way, V-Mart Retail has virtually no net debt, so it's fair to say it does not have a heavy debt load! When analysing debt levels, the balance sheet is the obvious place to start. But ultimately the future profitability of the business will decide if V-Mart Retail can strengthen its balance sheet over time. So if you're focused on the future you can check out this free report showing analyst profit forecasts.
Over 12 months, V-Mart Retail reported revenue of ₹28b, which is a gain of 13%, although it did not report any earnings before interest and tax. That rate of growth is a bit slow for our taste, but it takes all types to make a world.
Caveat Emptor
Over the last twelve months V-Mart Retail produced an earnings before interest and tax (EBIT) loss. Indeed, it lost ₹9.1m at the EBIT level. When we look at that and recall the liabilities on its balance sheet, relative to cash, it seems unwise to us for the company to have any debt. Quite frankly we think the balance sheet is far from match-fit, although it could be improved with time. We would feel better if it turned its trailing twelve month loss of ₹968m into a profit. So to be blunt we do think it is risky. When we look at a riskier company, we like to check how their profits (or losses) are trending over time. Today, we're providing readers this interactive graph showing how V-Mart Retail's profit, revenue, and operating cashflow have changed over the last few years.
If you're interested in investing in businesses that can grow profits without the burden of debt, then check out this free list of growing businesses that have net cash on the balance sheet.
New: Manage All Your Stock Portfolios in One Place
We've created the ultimate portfolio companion for stock investors, and it's free.
• Connect an unlimited number of Portfolios and see your total in one currency
• Be alerted to new Warning Signs or Risks via email or mobile
• Track the Fair Value of your stocks
Have feedback on this article? Concerned about the content? Get in touch with us directly. Alternatively, email editorial-team (at) simplywallst.com.
This article by Simply Wall St is general in nature. We provide commentary based on historical data and analyst forecasts only using an unbiased methodology and our articles are not intended to be financial advice. It does not constitute a recommendation to buy or sell any stock, and does not take account of your objectives, or your financial situation. We aim to bring you long-term focused analysis driven by fundamental data. Note that our analysis may not factor in the latest price-sensitive company announcements or qualitative material. Simply Wall St has no position in any stocks mentioned.
Have feedback on this article? Concerned about the content? Get in touch with us directly. Alternatively, email editorial-team@simplywallst.com
About NSEI:VMART
Reasonable growth potential with adequate balance sheet.
Similar Companies
Market Insights

Community Narratives

