
Advertisement
- India
- /
- Specialty Stores
- /
- NSEI:TRENT
Investing in Trent (NSE:TRENT) five years ago would have delivered you a 626% gain
For many, the main point of investing in the stock market is to achieve spectacular returns. While the best companies are hard to find, but they can generate massive returns over long periods. Just think about the savvy investors who held Trent Limited (NSE:TRENT) shares for the last five years, while they gained 622%. This just goes to show the value creation that some businesses can achieve. It's down 1.4% in the last seven days. It really delights us to see such great share price performance for investors.
Let's take a look at the underlying fundamentals over the longer term, and see if they've been consistent with shareholders returns.
While the efficient markets hypothesis continues to be taught by some, it has been proven that markets are over-reactive dynamic systems, and investors are not always rational. One flawed but reasonable way to assess how sentiment around a company has changed is to compare the earnings per share (EPS) with the share price.
During the five years of share price growth, Trent moved from a loss to profitability. That kind of transition can be an inflection point that justifies a strong share price gain, just as we have seen here. Given that the company made a profit three years ago, but not five years ago, it is worth looking at the share price returns over the last three years, too. We can see that the Trent share price is up 203% in the last three years. Meanwhile, EPS is up 63% per year. This EPS growth is higher than the 45% average annual increase in the share price over the same three years. Therefore, it seems the market has moderated its expectations for growth, somewhat. Of course, with a P/E ratio of 106.06, the market remains optimistic.
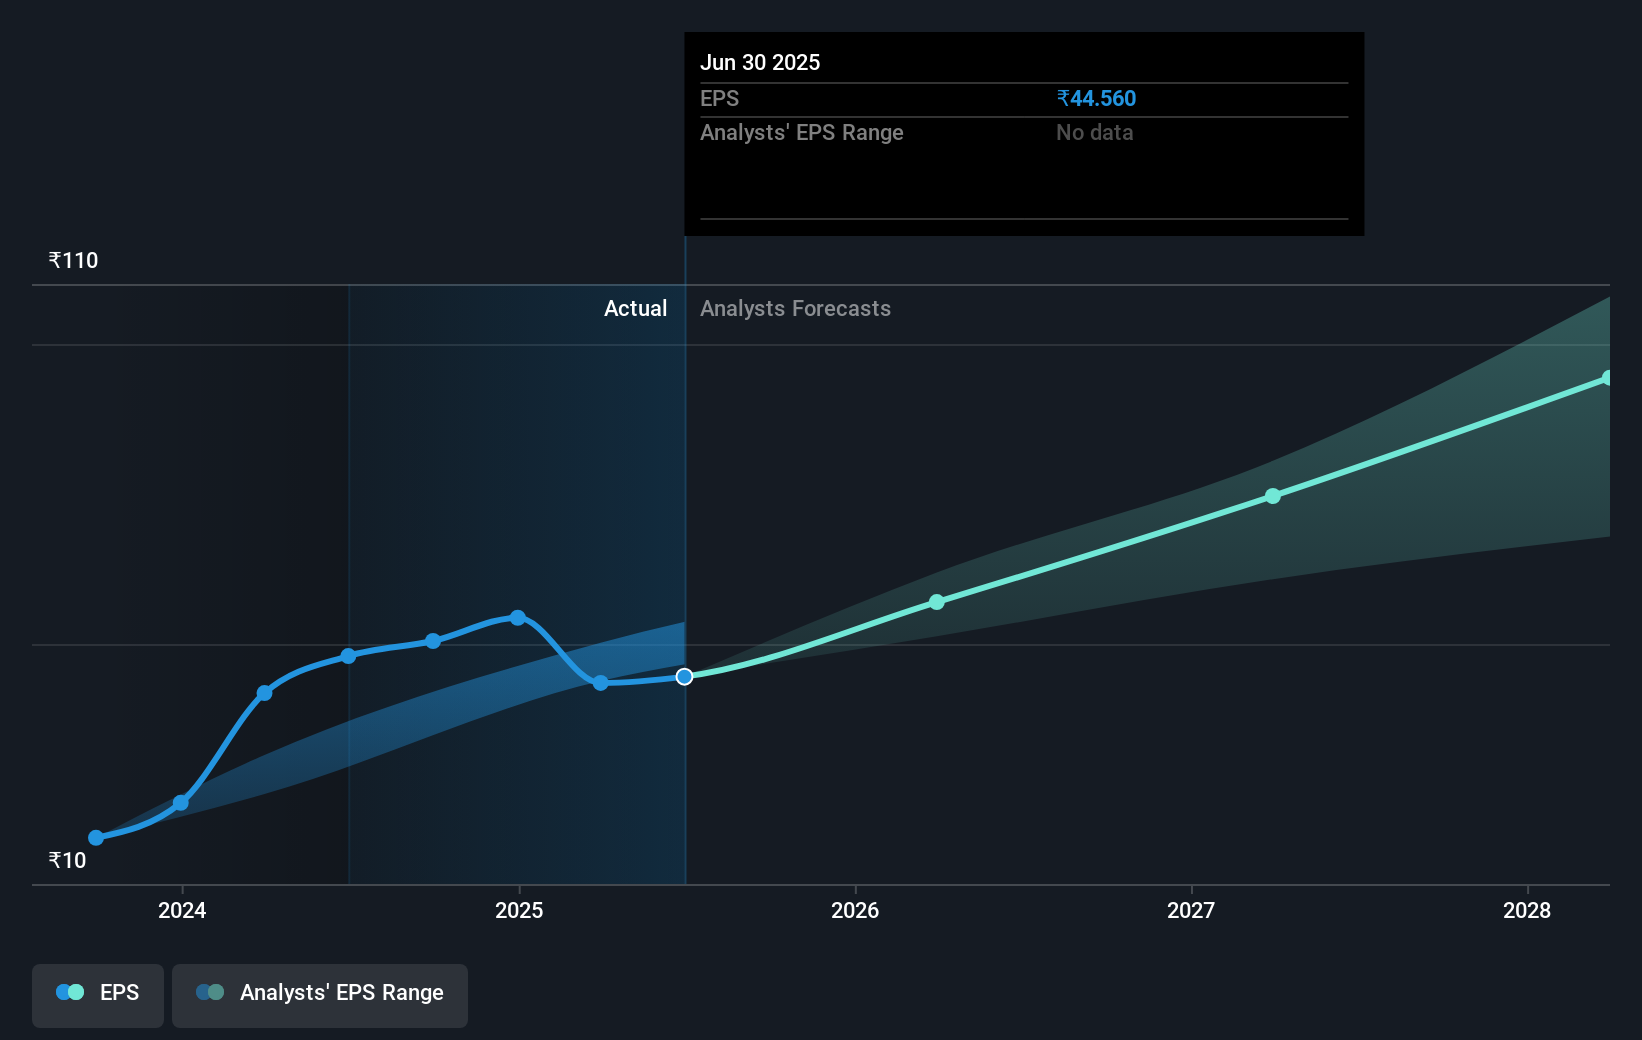
You can see below how EPS has changed over time (discover the exact values by clicking on the image).
We know that Trent has improved its bottom line over the last three years, but what does the future have in store? This free interactive report on Trent's balance sheet strength is a great place to start, if you want to investigate the stock further.
What About Dividends?
When looking at investment returns, it is important to consider the difference between total shareholder return (TSR) and share price return. The TSR is a return calculation that accounts for the value of cash dividends (assuming that any dividend received was reinvested) and the calculated value of any discounted capital raisings and spin-offs. It's fair to say that the TSR gives a more complete picture for stocks that pay a dividend. In the case of Trent, it has a TSR of 626% for the last 5 years. That exceeds its share price return that we previously mentioned. And there's no prize for guessing that the dividend payments largely explain the divergence!
A Different Perspective
Investors in Trent had a tough year, with a total loss of 36% (including dividends), against a market gain of about 4.5%. However, keep in mind that even the best stocks will sometimes underperform the market over a twelve month period. On the bright side, long term shareholders have made money, with a gain of 49% per year over half a decade. It could be that the recent sell-off is an opportunity, so it may be worth checking the fundamental data for signs of a long term growth trend. You could get a better understanding of Trent's growth by checking out this more detailed historical graph of earnings, revenue and cash flow.
If you are like me, then you will not want to miss this free list of undervalued small caps that insiders are buying.
Please note, the market returns quoted in this article reflect the market weighted average returns of stocks that currently trade on Indian exchanges.
Valuation is complex, but we're here to simplify it.
Discover if Trent might be undervalued or overvalued with our detailed analysis, featuring fair value estimates, potential risks, dividends, insider trades, and its financial condition.
Access Free AnalysisHave feedback on this article? Concerned about the content? Get in touch with us directly. Alternatively, email editorial-team (at) simplywallst.com.
This article by Simply Wall St is general in nature. We provide commentary based on historical data and analyst forecasts only using an unbiased methodology and our articles are not intended to be financial advice. It does not constitute a recommendation to buy or sell any stock, and does not take account of your objectives, or your financial situation. We aim to bring you long-term focused analysis driven by fundamental data. Note that our analysis may not factor in the latest price-sensitive company announcements or qualitative material. Simply Wall St has no position in any stocks mentioned.
About NSEI:TRENT
Trent
Engages in the retailing and trading of apparels, footwear, accessories, food, grocery, and non-food products in India.
Exceptional growth potential with flawless balance sheet.
Similar Companies
Market Insights

Advertisement
Community Narratives
The company that turned a verb into a global necessity and basically runs the modern internet, digital ads, smartphones, maps, and AI.
Fair Value US$300.00|10.8% undervalued
OS
Community Contributor
Flowers Foods Pays A Fair Price For Health
Fair Value US$16.12|22.0% undervalued
NV
Community Contributor
TMX Group will thrive with 33.3% profit margin and enduring market moat
Fair Value CA$49.90|3.8% overvalued
LI
Community Contributor