
Advertisement
Here's Why Shankara Building Products (NSE:SHANKARA) Can Manage Its Debt Responsibly
Howard Marks put it nicely when he said that, rather than worrying about share price volatility, 'The possibility of permanent loss is the risk I worry about... and every practical investor I know worries about.' So it might be obvious that you need to consider debt, when you think about how risky any given stock is, because too much debt can sink a company. We note that Shankara Building Products Limited (NSE:SHANKARA) does have debt on its balance sheet. But the real question is whether this debt is making the company risky.
What Risk Does Debt Bring?
Debt assists a business until the business has trouble paying it off, either with new capital or with free cash flow. In the worst case scenario, a company can go bankrupt if it cannot pay its creditors. While that is not too common, we often do see indebted companies permanently diluting shareholders because lenders force them to raise capital at a distressed price. Of course, debt can be an important tool in businesses, particularly capital heavy businesses. The first thing to do when considering how much debt a business uses is to look at its cash and debt together.
View our latest analysis for Shankara Building Products
What Is Shankara Building Products's Debt?
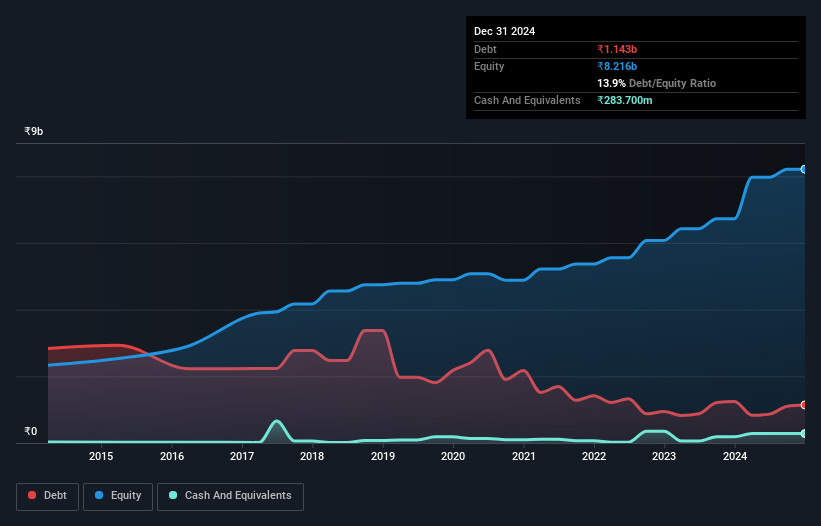
As you can see below, Shankara Building Products had ₹1.14b of debt at September 2024, down from ₹1.25b a year prior. However, it also had ₹283.7m in cash, and so its net debt is ₹858.9m.
How Healthy Is Shankara Building Products' Balance Sheet?
We can see from the most recent balance sheet that Shankara Building Products had liabilities of ₹8.38b falling due within a year, and liabilities of ₹202.0m due beyond that. Offsetting these obligations, it had cash of ₹283.7m as well as receivables valued at ₹7.36b due within 12 months. So its liabilities outweigh the sum of its cash and (near-term) receivables by ₹931.4m.
Of course, Shankara Building Products has a market capitalization of ₹12.9b, so these liabilities are probably manageable. Having said that, it's clear that we should continue to monitor its balance sheet, lest it change for the worse.
We use two main ratios to inform us about debt levels relative to earnings. The first is net debt divided by earnings before interest, tax, depreciation, and amortization (EBITDA), while the second is how many times its earnings before interest and tax (EBIT) covers its interest expense (or its interest cover, for short). This way, we consider both the absolute quantum of the debt, as well as the interest rates paid on it.
While Shankara Building Products's low debt to EBITDA ratio of 0.54 suggests only modest use of debt, the fact that EBIT only covered the interest expense by 3.2 times last year does give us pause. But the interest payments are certainly sufficient to have us thinking about how affordable its debt is. One way Shankara Building Products could vanquish its debt would be if it stops borrowing more but continues to grow EBIT at around 12%, as it did over the last year. When analysing debt levels, the balance sheet is the obvious place to start. But it is Shankara Building Products's earnings that will influence how the balance sheet holds up in the future. So when considering debt, it's definitely worth looking at the earnings trend. Click here for an interactive snapshot.
Finally, a company can only pay off debt with cold hard cash, not accounting profits. So the logical step is to look at the proportion of that EBIT that is matched by actual free cash flow. Over the last three years, Shankara Building Products reported free cash flow worth 8.7% of its EBIT, which is really quite low. That limp level of cash conversion undermines its ability to manage and pay down debt.
Our View
When it comes to the balance sheet, the standout positive for Shankara Building Products was the fact that it seems able handle its debt, based on its EBITDA, confidently. However, our other observations weren't so heartening. For example, its conversion of EBIT to free cash flow makes us a little nervous about its debt. Looking at all this data makes us feel a little cautious about Shankara Building Products's debt levels. While we appreciate debt can enhance returns on equity, we'd suggest that shareholders keep close watch on its debt levels, lest they increase. There's no doubt that we learn most about debt from the balance sheet. But ultimately, every company can contain risks that exist outside of the balance sheet. To that end, you should be aware of the 1 warning sign we've spotted with Shankara Building Products .
If, after all that, you're more interested in a fast growing company with a rock-solid balance sheet, then check out our list of net cash growth stocks without delay.
New: Manage All Your Stock Portfolios in One Place
We've created the ultimate portfolio companion for stock investors, and it's free.
• Connect an unlimited number of Portfolios and see your total in one currency
• Be alerted to new Warning Signs or Risks via email or mobile
• Track the Fair Value of your stocks
Have feedback on this article? Concerned about the content? Get in touch with us directly. Alternatively, email editorial-team (at) simplywallst.com.
This article by Simply Wall St is general in nature. We provide commentary based on historical data and analyst forecasts only using an unbiased methodology and our articles are not intended to be financial advice. It does not constitute a recommendation to buy or sell any stock, and does not take account of your objectives, or your financial situation. We aim to bring you long-term focused analysis driven by fundamental data. Note that our analysis may not factor in the latest price-sensitive company announcements or qualitative material. Simply Wall St has no position in any stocks mentioned.
About NSEI:SHANKARA
Shankara Building Products
Operates as a retailer of home improvement and building products in India.
Flawless balance sheet, good value and pays a dividend.
Market Insights

Advertisement
Weekly Picks
RO


RockeTeller on Santacruz Silver Mining ·
Crazy Undervalued 42 Baggers Silver Play (Active & Running Mine)
Fair Value:CA$8696.7% undervalued
64 followersusers have followed this narrative
7 commentsusers have commented on this narrative
19 likesusers have liked this narrative
RO


Robbo on Fiducian Group ·
Fiducian: Compliance Clouds or Value Opportunity?
Fair Value:AU$122.0% undervalued
9 followersusers have followed this narrative
0 commentsusers have commented on this narrative
0 likesusers have liked this narrative
WO

woodworthfund on Willamette Valley Vineyards ·
Willamette Valley Vineyards (WVVI): Not-So-Great Value
Fair Value:US$242.5% overvalued
11 followersusers have followed this narrative
0 commentsusers have commented on this narrative
1 likeusers have liked this narrative
Recently Updated Narratives
IN

IncomeAssets on Magma Silver ·
Silver's Breakout to over $50US will make Magma’s future shine with drill sampling returning 115g/t Silver and 2.3 g/t Gold at its Peru Mine
Fair Value:CA$0.3534.3% undervalued
1 followerusers have followed this narrative
0 commentsusers have commented on this narrative
0 likesusers have liked this narrative
CO

composite32 on SEGRO ·
SEGRO's Revenue to Rise 14.7% Amidst Optimistic Growth Plans
Fair Value:UK£9.3924.7% undervalued
0 followersusers have followed this narrative
0 commentsusers have commented on this narrative
0 likesusers have liked this narrative
PI

PicaCoder on Microsoft ·
After the AI Party: A Sobering Look at Microsoft's Future
Fair Value:US$42015.0% overvalued
62 followersusers have followed this narrative
12 commentsusers have commented on this narrative
0 likesusers have liked this narrative
Popular Narratives
TH


TheWallstreetKing on MicroVision ·
MicroVision will explode future revenue by 380.37% with a vision towards success
Fair Value:US$6098.5% undervalued
118 followersusers have followed this narrative
11 commentsusers have commented on this narrative
22 likesusers have liked this narrative
AN


AnalystConsensusTarget on NVIDIA ·
NVDA: Expanding AI Demand Will Drive Major Data Center Investments Through 2026
Fair Value:US$250.3927.2% undervalued
958 followersusers have followed this narrative
6 commentsusers have commented on this narrative
25 likesusers have liked this narrative
RO
RockeTeller on Santacruz Silver Mining ·
Crazy Undervalued 42 Baggers Silver Play (Active & Running Mine)
Fair Value:CA$8696.7% undervalued
64 followersusers have followed this narrative
7 commentsusers have commented on this narrative
19 likesusers have liked this narrative
