- India
- /
- Real Estate
- /
- NSEI:SBGLP
After Leaping 28% Suratwwala Business Group Limited (NSE:SBGLP) Shares Are Not Flying Under The Radar

Despite an already strong run, Suratwwala Business Group Limited (NSE:SBGLP) shares have been powering on, with a gain of 28% in the last thirty days. The last 30 days were the cherry on top of the stock's 417% gain in the last year, which is nothing short of spectacular.
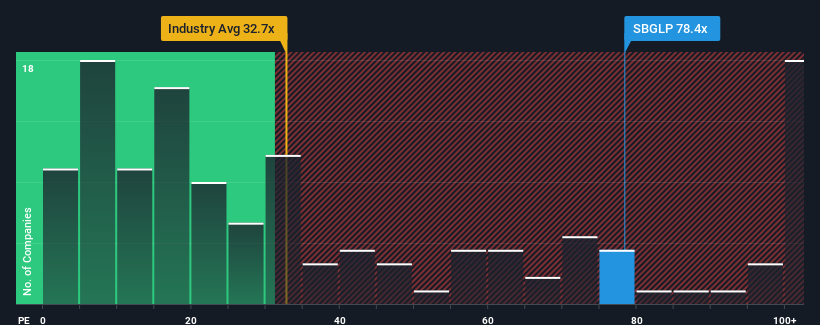
Since its price has surged higher, Suratwwala Business Group's price-to-earnings (or "P/E") ratio of 78.4x might make it look like a strong sell right now compared to the market in India, where around half of the companies have P/E ratios below 31x and even P/E's below 17x are quite common. However, the P/E might be quite high for a reason and it requires further investigation to determine if it's justified.
The recent earnings growth at Suratwwala Business Group would have to be considered satisfactory if not spectacular. It might be that many expect the reasonable earnings performance to beat most other companies over the coming period, which has increased investors’ willingness to pay up for the stock. If not, then existing shareholders may be a little nervous about the viability of the share price.
See our latest analysis for Suratwwala Business Group

Does Growth Match The High P/E?
In order to justify its P/E ratio, Suratwwala Business Group would need to produce outstanding growth well in excess of the market.
Taking a look back first, we see that the company managed to grow earnings per share by a handy 5.9% last year. Pleasingly, EPS has also lifted 204% in aggregate from three years ago, partly thanks to the last 12 months of growth. So we can start by confirming that the company has done a great job of growing earnings over that time.
This is in contrast to the rest of the market, which is expected to grow by 24% over the next year, materially lower than the company's recent medium-term annualised growth rates.
With this information, we can see why Suratwwala Business Group is trading at such a high P/E compared to the market. It seems most investors are expecting this strong growth to continue and are willing to pay more for the stock.
The Bottom Line On Suratwwala Business Group's P/E
Suratwwala Business Group's P/E is flying high just like its stock has during the last month. Generally, our preference is to limit the use of the price-to-earnings ratio to establishing what the market thinks about the overall health of a company.
As we suspected, our examination of Suratwwala Business Group revealed its three-year earnings trends are contributing to its high P/E, given they look better than current market expectations. At this stage investors feel the potential for a deterioration in earnings isn't great enough to justify a lower P/E ratio. If recent medium-term earnings trends continue, it's hard to see the share price falling strongly in the near future under these circumstances.
You always need to take note of risks, for example - Suratwwala Business Group has 1 warning sign we think you should be aware of.
It's important to make sure you look for a great company, not just the first idea you come across. So take a peek at this free list of interesting companies with strong recent earnings growth (and a low P/E).
New: Manage All Your Stock Portfolios in One Place
We've created the ultimate portfolio companion for stock investors, and it's free.
• Connect an unlimited number of Portfolios and see your total in one currency
• Be alerted to new Warning Signs or Risks via email or mobile
• Track the Fair Value of your stocks
Have feedback on this article? Concerned about the content? Get in touch with us directly. Alternatively, email editorial-team (at) simplywallst.com.
This article by Simply Wall St is general in nature. We provide commentary based on historical data and analyst forecasts only using an unbiased methodology and our articles are not intended to be financial advice. It does not constitute a recommendation to buy or sell any stock, and does not take account of your objectives, or your financial situation. We aim to bring you long-term focused analysis driven by fundamental data. Note that our analysis may not factor in the latest price-sensitive company announcements or qualitative material. Simply Wall St has no position in any stocks mentioned.
About NSEI:SBGLP
Suratwwala Business Group
A real estate development company, engages in the construction of residential, commercial, and IT parks properties in India.
Flawless balance sheet with questionable track record.
Similar Companies
Market Insights
Community Narratives


