
Advertisement
- India
- /
- Real Estate
- /
- NSEI:PANSARI
Pansari Developers Limited (NSE:PANSARI) Is Going Strong But Fundamentals Appear To Be Mixed : Is There A Clear Direction For The Stock?

Pansari Developers (NSE:PANSARI) has had a great run on the share market with its stock up by a significant 37% over the last three months. But the company's key financial indicators appear to be differing across the board and that makes us question whether or not the company's current share price momentum can be maintained. In this article, we decided to focus on Pansari Developers' ROE.
ROE or return on equity is a useful tool to assess how effectively a company can generate returns on the investment it received from its shareholders. In simpler terms, it measures the profitability of a company in relation to shareholder's equity.
How To Calculate Return On Equity?
ROE can be calculated by using the formula:
Return on Equity = Net Profit (from continuing operations) ÷ Shareholders' Equity
So, based on the above formula, the ROE for Pansari Developers is:
2.8% = ₹36m ÷ ₹1.3b (Based on the trailing twelve months to December 2024).
The 'return' is the amount earned after tax over the last twelve months. That means that for every ₹1 worth of shareholders' equity, the company generated ₹0.03 in profit.
Check out our latest analysis for Pansari Developers
Why Is ROE Important For Earnings Growth?
We have already established that ROE serves as an efficient profit-generating gauge for a company's future earnings. Depending on how much of these profits the company reinvests or "retains", and how effectively it does so, we are then able to assess a company’s earnings growth potential. Assuming all else is equal, companies that have both a higher return on equity and higher profit retention are usually the ones that have a higher growth rate when compared to companies that don't have the same features.
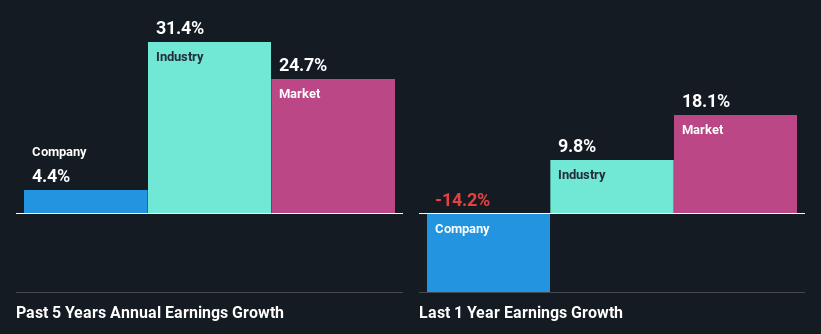
A Side By Side comparison of Pansari Developers' Earnings Growth And 2.8% ROE
As you can see, Pansari Developers' ROE looks pretty weak. Not just that, even compared to the industry average of 6.5%, the company's ROE is entirely unremarkable. Accordingly, Pansari Developers' low net income growth of 4.4% over the past five years can possibly be explained by the low ROE amongst other factors.
As a next step, we compared Pansari Developers' net income growth with the industry and were disappointed to see that the company's growth is lower than the industry average growth of 31% in the same period.
Earnings growth is an important metric to consider when valuing a stock. It’s important for an investor to know whether the market has priced in the company's expected earnings growth (or decline). This then helps them determine if the stock is placed for a bright or bleak future. One good indicator of expected earnings growth is the P/E ratio which determines the price the market is willing to pay for a stock based on its earnings prospects. So, you may want to check if Pansari Developers is trading on a high P/E or a low P/E, relative to its industry.
Is Pansari Developers Efficiently Re-investing Its Profits?
Pansari Developers doesn't pay any regular dividends currently which essentially means that it has been reinvesting all of its profits into the business. This doesn't explain the low earnings growth number that we discussed above. Therefore, there might be some other reasons to explain the lack in that respect. For example, the business could be in decline.
Summary
Overall, we have mixed feelings about Pansari Developers. While the company does have a high rate of profit retention, its low rate of return is probably hampering its earnings growth. Wrapping up, we would proceed with caution with this company and one way of doing that would be to look at the risk profile of the business. Our risks dashboard would have the 3 risks we have identified for Pansari Developers.
New: Manage All Your Stock Portfolios in One Place
We've created the ultimate portfolio companion for stock investors, and it's free.
• Connect an unlimited number of Portfolios and see your total in one currency
• Be alerted to new Warning Signs or Risks via email or mobile
• Track the Fair Value of your stocks
Have feedback on this article? Concerned about the content? Get in touch with us directly. Alternatively, email editorial-team (at) simplywallst.com.
This article by Simply Wall St is general in nature. We provide commentary based on historical data and analyst forecasts only using an unbiased methodology and our articles are not intended to be financial advice. It does not constitute a recommendation to buy or sell any stock, and does not take account of your objectives, or your financial situation. We aim to bring you long-term focused analysis driven by fundamental data. Note that our analysis may not factor in the latest price-sensitive company announcements or qualitative material. Simply Wall St has no position in any stocks mentioned.
About NSEI:PANSARI
Pansari Developers
Operates as a construction and real estate development company in India.
Excellent balance sheet with acceptable track record.
Similar Companies
Market Insights

Advertisement
Community Narratives
WhiteCap Is Positioned To Profit Regardless Of Trump's Policy 
Fair Value CA$22.60|61.7% undervalued
ST
Equity Analyst and Writer
Microsoft's Evolution Will Drive Revenue to New Heights Fueled by AI
Fair Value US$360.00|28.9% overvalued
BR
Community Contributor
A CASE FOR USD$2.50 (CAD$3.44) BY 2028 (A 5-10 BAGGER)
Fair Value CA$3.44|88.1% undervalued
AG
Community Contributor