Further weakness as Sun Pharma Advanced Research (NSE:SPARC) drops 7.7% this week, taking five-year losses to 56%

Statistically speaking, long term investing is a profitable endeavour. But along the way some stocks are going to perform badly. For example, after five long years the Sun Pharma Advanced Research Company Limited (NSE:SPARC) share price is a whole 56% lower. That's not a lot of fun for true believers. Unfortunately the share price momentum is still quite negative, with prices down 8.2% in thirty days. This could be related to the recent financial results - you can catch up on the most recent data by reading our company report.
After losing 7.7% this past week, it's worth investigating the company's fundamentals to see what we can infer from past performance.
See our latest analysis for Sun Pharma Advanced Research
SWOT Analysis for Sun Pharma Advanced Research
- Debt is well covered by earnings.
- Shareholders have been diluted in the past year.
- Has sufficient cash runway for more than 3 years based on current free cash flows.
- Lack of analyst coverage makes it difficult to determine SPARC's earnings prospects.
- Debt is not well covered by operating cash flow.
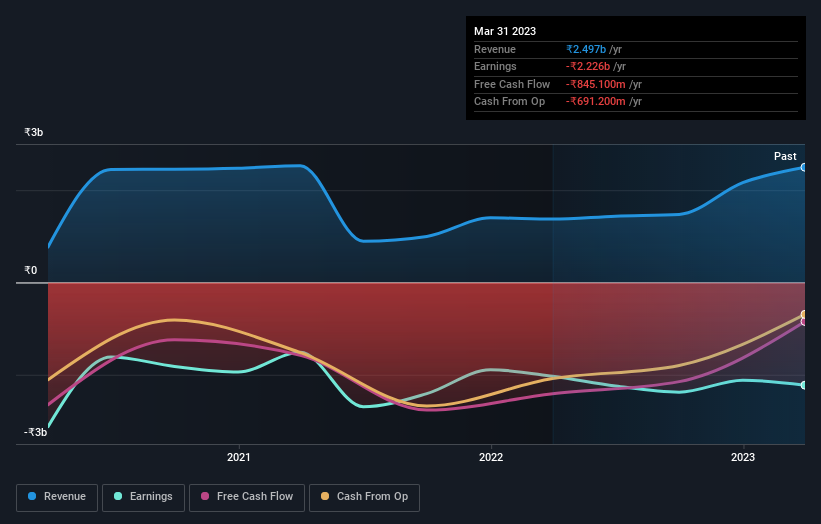
Sun Pharma Advanced Research wasn't profitable in the last twelve months, it is unlikely we'll see a strong correlation between its share price and its earnings per share (EPS). Arguably revenue is our next best option. Shareholders of unprofitable companies usually expect strong revenue growth. Some companies are willing to postpone profitability to grow revenue faster, but in that case one does expect good top-line growth.
In the last half decade, Sun Pharma Advanced Research saw its revenue increase by 9.8% per year. That's a pretty good rate for a long time period. The share price return isn't so respectable with an annual loss of 9% over the period. It seems probably that the business has failed to live up to initial expectations. A pessimistic market can create opportunities.
The image below shows how earnings and revenue have tracked over time (if you click on the image you can see greater detail).

Balance sheet strength is crucial. It might be well worthwhile taking a look at our free report on how its financial position has changed over time.
A Different Perspective
Investors in Sun Pharma Advanced Research had a tough year, with a total loss of 15%, against a market gain of about 13%. However, keep in mind that even the best stocks will sometimes underperform the market over a twelve month period. Regrettably, last year's performance caps off a bad run, with the shareholders facing a total loss of 9% per year over five years. We realise that Baron Rothschild has said investors should "buy when there is blood on the streets", but we caution that investors should first be sure they are buying a high quality business. It's always interesting to track share price performance over the longer term. But to understand Sun Pharma Advanced Research better, we need to consider many other factors. Consider for instance, the ever-present spectre of investment risk. We've identified 2 warning signs with Sun Pharma Advanced Research (at least 1 which is potentially serious) , and understanding them should be part of your investment process.
If you would prefer to check out another company -- one with potentially superior financials -- then do not miss this free list of companies that have proven they can grow earnings.
Please note, the market returns quoted in this article reflect the market weighted average returns of stocks that currently trade on Indian exchanges.
New: Manage All Your Stock Portfolios in One Place
We've created the ultimate portfolio companion for stock investors, and it's free.
• Connect an unlimited number of Portfolios and see your total in one currency
• Be alerted to new Warning Signs or Risks via email or mobile
• Track the Fair Value of your stocks
Have feedback on this article? Concerned about the content? Get in touch with us directly. Alternatively, email editorial-team (at) simplywallst.com.
This article by Simply Wall St is general in nature. We provide commentary based on historical data and analyst forecasts only using an unbiased methodology and our articles are not intended to be financial advice. It does not constitute a recommendation to buy or sell any stock, and does not take account of your objectives, or your financial situation. We aim to bring you long-term focused analysis driven by fundamental data. Note that our analysis may not factor in the latest price-sensitive company announcements or qualitative material. Simply Wall St has no position in any stocks mentioned.
About NSEI:SPARC
Sun Pharma Advanced Research
A clinical-stage biopharmaceutical company, engages in the research and development of pharmaceutical products in India and internationally.
Low with weak fundamentals.
Market Insights
Community Narratives


