
David Iben put it well when he said, 'Volatility is not a risk we care about. What we care about is avoiding the permanent loss of capital.' When we think about how risky a company is, we always like to look at its use of debt, since debt overload can lead to ruin. As with many other companies Brooks Laboratories Limited (NSE:BROOKS) makes use of debt. But is this debt a concern to shareholders?
When Is Debt A Problem?
Debt assists a business until the business has trouble paying it off, either with new capital or with free cash flow. If things get really bad, the lenders can take control of the business. While that is not too common, we often do see indebted companies permanently diluting shareholders because lenders force them to raise capital at a distressed price. Of course, debt can be an important tool in businesses, particularly capital heavy businesses. The first thing to do when considering how much debt a business uses is to look at its cash and debt together.
See our latest analysis for Brooks Laboratories
How Much Debt Does Brooks Laboratories Carry?
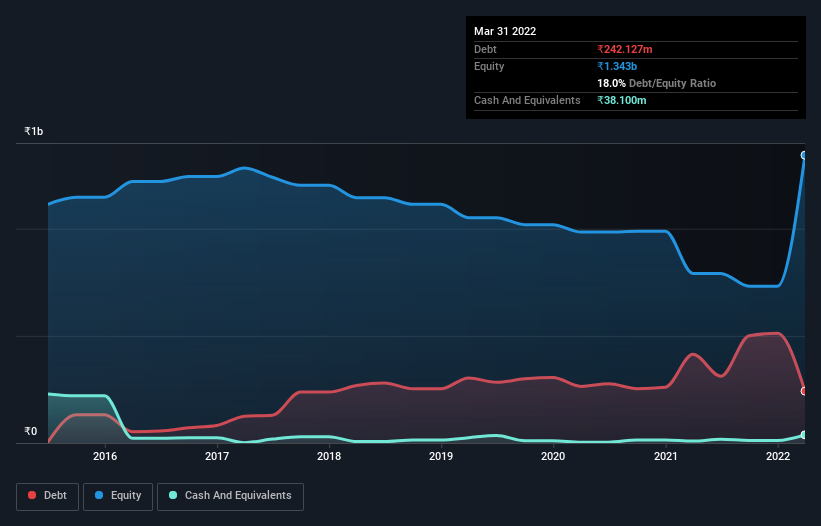
The image below, which you can click on for greater detail, shows that Brooks Laboratories had debt of ₹242.1m at the end of March 2022, a reduction from ₹413.8m over a year. However, it also had ₹38.1m in cash, and so its net debt is ₹204.0m.
A Look At Brooks Laboratories' Liabilities
Zooming in on the latest balance sheet data, we can see that Brooks Laboratories had liabilities of ₹488.8m due within 12 months and liabilities of ₹127.1m due beyond that. Offsetting these obligations, it had cash of ₹38.1m as well as receivables valued at ₹190.3m due within 12 months. So its liabilities outweigh the sum of its cash and (near-term) receivables by ₹387.5m.
Since publicly traded Brooks Laboratories shares are worth a total of ₹2.40b, it seems unlikely that this level of liabilities would be a major threat. However, we do think it is worth keeping an eye on its balance sheet strength, as it may change over time. When analysing debt levels, the balance sheet is the obvious place to start. But it is Brooks Laboratories's earnings that will influence how the balance sheet holds up in the future. So when considering debt, it's definitely worth looking at the earnings trend. Click here for an interactive snapshot.
Over 12 months, Brooks Laboratories reported revenue of ₹920m, which is a gain of 18%, although it did not report any earnings before interest and tax. We usually like to see faster growth from unprofitable companies, but each to their own.
Caveat Emptor
Over the last twelve months Brooks Laboratories produced an earnings before interest and tax (EBIT) loss. Indeed, it lost ₹208m at the EBIT level. Considering that alongside the liabilities mentioned above does not give us much confidence that company should be using so much debt. Quite frankly we think the balance sheet is far from match-fit, although it could be improved with time. Another cause for caution is that is bled ₹651m in negative free cash flow over the last twelve months. So in short it's a really risky stock. There's no doubt that we learn most about debt from the balance sheet. But ultimately, every company can contain risks that exist outside of the balance sheet. To that end, you should learn about the 4 warning signs we've spotted with Brooks Laboratories (including 2 which are significant) .
When all is said and done, sometimes its easier to focus on companies that don't even need debt. Readers can access a list of growth stocks with zero net debt 100% free, right now.
If you're looking to trade Brooks Laboratories, open an account with the lowest-cost platform trusted by professionals, Interactive Brokers.
With clients in over 200 countries and territories, and access to 160 markets, IBKR lets you trade stocks, options, futures, forex, bonds and funds from a single integrated account.
Enjoy no hidden fees, no account minimums, and FX conversion rates as low as 0.03%, far better than what most brokers offer.
Sponsored ContentValuation is complex, but we're here to simplify it.
Discover if Brooks Laboratories might be undervalued or overvalued with our detailed analysis, featuring fair value estimates, potential risks, dividends, insider trades, and its financial condition.
Access Free AnalysisHave feedback on this article? Concerned about the content? Get in touch with us directly. Alternatively, email editorial-team (at) simplywallst.com.
This article by Simply Wall St is general in nature. We provide commentary based on historical data and analyst forecasts only using an unbiased methodology and our articles are not intended to be financial advice. It does not constitute a recommendation to buy or sell any stock, and does not take account of your objectives, or your financial situation. We aim to bring you long-term focused analysis driven by fundamental data. Note that our analysis may not factor in the latest price-sensitive company announcements or qualitative material. Simply Wall St has no position in any stocks mentioned.
About NSEI:BROOKS
Brooks Laboratories
Manufactures and sells pharmaceuticals in India and internationally.
Flawless balance sheet very low.
Market Insights

Community Narratives

