

To find a multi-bagger stock, what are the underlying trends we should look for in a business? Ideally, a business will show two trends; firstly a growing return on capital employed (ROCE) and secondly, an increasing amount of capital employed. This shows us that it's a compounding machine, able to continually reinvest its earnings back into the business and generate higher returns. Although, when we looked at S Chand (NSE:SCHAND), it didn't seem to tick all of these boxes.
Understanding Return On Capital Employed (ROCE)
If you haven't worked with ROCE before, it measures the 'return' (pre-tax profit) a company generates from capital employed in its business. The formula for this calculation on S Chand is:
Return on Capital Employed = Earnings Before Interest and Tax (EBIT) ÷ (Total Assets - Current Liabilities)
0.002 = ₹17m ÷ (₹12b - ₹2.7b) (Based on the trailing twelve months to September 2020).
Therefore, S Chand has an ROCE of 0.2%. In absolute terms, that's a low return and it also under-performs the Media industry average of 11%.
View our latest analysis for S Chand
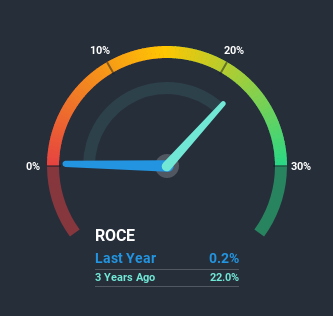
In the above chart we have measured S Chand's prior ROCE against its prior performance, but the future is arguably more important. If you're interested, you can view the analysts predictions in our free report on analyst forecasts for the company.
So How Is S Chand's ROCE Trending?
On the surface, the trend of ROCE at S Chand doesn't inspire confidence. To be more specific, ROCE has fallen from 15% over the last five years. Given the business is employing more capital while revenue has slipped, this is a bit concerning. This could mean that the business is losing its competitive advantage or market share, because while more money is being put into ventures, it's actually producing a lower return - "less bang for their buck" per se.
Our Take On S Chand's ROCE
We're a bit apprehensive about S Chand because despite more capital being deployed in the business, returns on that capital and sales have both fallen. Unsurprisingly then, the stock has dived 85% over the last three years, so investors are recognizing these changes and don't like the company's prospects. With underlying trends that aren't great in these areas, we'd consider looking elsewhere.
S Chand does have some risks though, and we've spotted 1 warning sign for S Chand that you might be interested in.
While S Chand may not currently earn the highest returns, we've compiled a list of companies that currently earn more than 25% return on equity. Check out this free list here.
If you’re looking to trade S Chand, open an account with the lowest-cost* platform trusted by professionals, Interactive Brokers. Their clients from over 200 countries and territories trade stocks, options, futures, forex, bonds and funds worldwide from a single integrated account. Promoted
If you're looking to trade S Chand, open an account with the lowest-cost platform trusted by professionals, Interactive Brokers.
With clients in over 200 countries and territories, and access to 160 markets, IBKR lets you trade stocks, options, futures, forex, bonds and funds from a single integrated account.
Enjoy no hidden fees, no account minimums, and FX conversion rates as low as 0.03%, far better than what most brokers offer.
Sponsored ContentNew: Manage All Your Stock Portfolios in One Place
We've created the ultimate portfolio companion for stock investors, and it's free.
• Connect an unlimited number of Portfolios and see your total in one currency
• Be alerted to new Warning Signs or Risks via email or mobile
• Track the Fair Value of your stocks
This article by Simply Wall St is general in nature. It does not constitute a recommendation to buy or sell any stock, and does not take account of your objectives, or your financial situation. We aim to bring you long-term focused analysis driven by fundamental data. Note that our analysis may not factor in the latest price-sensitive company announcements or qualitative material. Simply Wall St has no position in any stocks mentioned.
*Interactive Brokers Rated Lowest Cost Broker by StockBrokers.com Annual Online Review 2020
Have feedback on this article? Concerned about the content? Get in touch with us directly. Alternatively, email editorial-team@simplywallst.com.
About NSEI:SCHAND
S Chand
S Chand and Company Limited, an education content company, develops and delivers content, solutions, and services for the early learning, K-12, and higher education segments in India.
Flawless balance sheet with solid track record and pays a dividend.
Similar Companies
Market Insights

Community Narratives

