- India
- /
- Entertainment
- /
- NSEI:SAREGAMA
What Saregama India Limited's (NSE:SAREGAMA) P/E Is Not Telling You

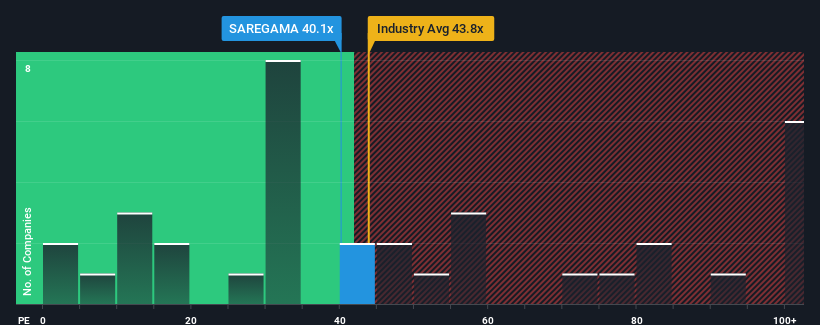
Saregama India Limited's (NSE:SAREGAMA) price-to-earnings (or "P/E") ratio of 40.1x might make it look like a sell right now compared to the market in India, where around half of the companies have P/E ratios below 31x and even P/E's below 17x are quite common. Although, it's not wise to just take the P/E at face value as there may be an explanation why it's as high as it is.
While the market has experienced earnings growth lately, Saregama India's earnings have gone into reverse gear, which is not great. One possibility is that the P/E is high because investors think this poor earnings performance will turn the corner. If not, then existing shareholders may be extremely nervous about the viability of the share price.
View our latest analysis for Saregama India

How Is Saregama India's Growth Trending?
Saregama India's P/E ratio would be typical for a company that's expected to deliver solid growth, and importantly, perform better than the market.
Retrospectively, the last year delivered virtually the same number to the company's bottom line as the year before. Still, the latest three year period has seen an excellent 84% overall rise in EPS, in spite of its uninspiring short-term performance. Accordingly, shareholders would have probably welcomed those medium-term rates of earnings growth.
Shifting to the future, estimates from the two analysts covering the company suggest earnings should grow by 23% over the next year. With the market predicted to deliver 24% growth , the company is positioned for a comparable earnings result.
In light of this, it's curious that Saregama India's P/E sits above the majority of other companies. It seems most investors are ignoring the fairly average growth expectations and are willing to pay up for exposure to the stock. Although, additional gains will be difficult to achieve as this level of earnings growth is likely to weigh down the share price eventually.
The Final Word
We'd say the price-to-earnings ratio's power isn't primarily as a valuation instrument but rather to gauge current investor sentiment and future expectations.
Our examination of Saregama India's analyst forecasts revealed that its market-matching earnings outlook isn't impacting its high P/E as much as we would have predicted. Right now we are uncomfortable with the relatively high share price as the predicted future earnings aren't likely to support such positive sentiment for long. Unless these conditions improve, it's challenging to accept these prices as being reasonable.
And what about other risks? Every company has them, and we've spotted 1 warning sign for Saregama India you should know about.
It's important to make sure you look for a great company, not just the first idea you come across. So take a peek at this free list of interesting companies with strong recent earnings growth (and a low P/E).
New: Manage All Your Stock Portfolios in One Place
We've created the ultimate portfolio companion for stock investors, and it's free.
• Connect an unlimited number of Portfolios and see your total in one currency
• Be alerted to new Warning Signs or Risks via email or mobile
• Track the Fair Value of your stocks
Have feedback on this article? Concerned about the content? Get in touch with us directly. Alternatively, email editorial-team (at) simplywallst.com.
This article by Simply Wall St is general in nature. We provide commentary based on historical data and analyst forecasts only using an unbiased methodology and our articles are not intended to be financial advice. It does not constitute a recommendation to buy or sell any stock, and does not take account of your objectives, or your financial situation. We aim to bring you long-term focused analysis driven by fundamental data. Note that our analysis may not factor in the latest price-sensitive company announcements or qualitative material. Simply Wall St has no position in any stocks mentioned.
About NSEI:SAREGAMA
Saregama India
Operates as an entertainment company in India and internationally.
Flawless balance sheet with reasonable growth potential and pays a dividend.
Similar Companies
Market Insights
Community Narratives


