- India
- /
- Entertainment
- /
- NSEI:SABTNL
Calculating The Fair Value Of Sri Adhikari Brothers Television Network Limited (NSE:SABTN)


Key Insights
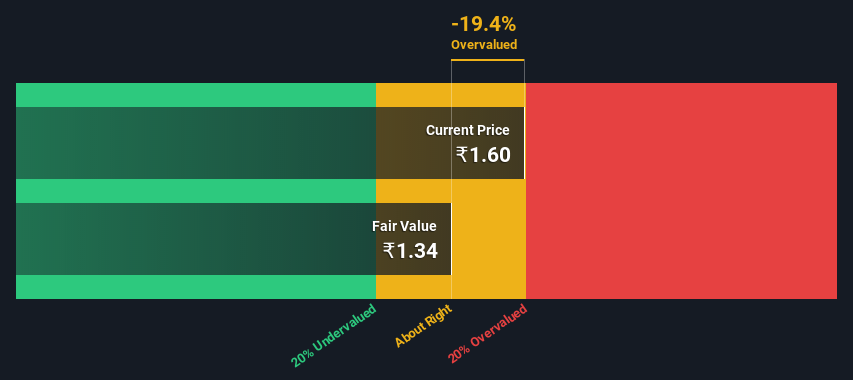
- The projected fair value for Sri Adhikari Brothers Television Network is ₹1.34 based on 2 Stage Free Cash Flow to Equity
- With ₹1.60 share price, Sri Adhikari Brothers Television Network appears to be trading close to its estimated fair value
- When compared to theindustry average discount of -226%, Sri Adhikari Brothers Television Network's competitors seem to be trading at a greater premium to fair value
Today we will run through one way of estimating the intrinsic value of Sri Adhikari Brothers Television Network Limited (NSE:SABTN) by taking the forecast future cash flows of the company and discounting them back to today's value. The Discounted Cash Flow (DCF) model is the tool we will apply to do this. Models like these may appear beyond the comprehension of a lay person, but they're fairly easy to follow.
We would caution that there are many ways of valuing a company and, like the DCF, each technique has advantages and disadvantages in certain scenarios. If you want to learn more about discounted cash flow, the rationale behind this calculation can be read in detail in the Simply Wall St analysis model.
See our latest analysis for Sri Adhikari Brothers Television Network
Crunching The Numbers
We are going to use a two-stage DCF model, which, as the name states, takes into account two stages of growth. The first stage is generally a higher growth period which levels off heading towards the terminal value, captured in the second 'steady growth' period. To begin with, we have to get estimates of the next ten years of cash flows. Seeing as no analyst estimates of free cash flow are available to us, we have extrapolate the previous free cash flow (FCF) from the company's last reported value. We assume companies with shrinking free cash flow will slow their rate of shrinkage, and that companies with growing free cash flow will see their growth rate slow, over this period. We do this to reflect that growth tends to slow more in the early years than it does in later years.
Generally we assume that a dollar today is more valuable than a dollar in the future, and so the sum of these future cash flows is then discounted to today's value:
10-year free cash flow (FCF) estimate
| 2023 | 2024 | 2025 | 2026 | 2027 | 2028 | 2029 | 2030 | 2031 | 2032 | |
| Levered FCF (₹, Millions) | ₹2.21m | ₹3.32m | ₹4.57m | ₹5.85m | ₹7.13m | ₹8.36m | ₹9.54m | ₹10.7m | ₹11.8m | ₹12.9m |
| Growth Rate Estimate Source | Est @ 69.21% | Est @ 50.49% | Est @ 37.38% | Est @ 28.21% | Est @ 21.79% | Est @ 17.29% | Est @ 14.14% | Est @ 11.94% | Est @ 10.40% | Est @ 9.32% |
| Present Value (₹, Millions) Discounted @ 18% | ₹1.9 | ₹2.4 | ₹2.8 | ₹3.0 | ₹3.1 | ₹3.1 | ₹3.0 | ₹2.8 | ₹2.6 | ₹2.4 |
("Est" = FCF growth rate estimated by Simply Wall St)
Present Value of 10-year Cash Flow (PVCF) = ₹27m
After calculating the present value of future cash flows in the initial 10-year period, we need to calculate the Terminal Value, which accounts for all future cash flows beyond the first stage. For a number of reasons a very conservative growth rate is used that cannot exceed that of a country's GDP growth. In this case we have used the 5-year average of the 10-year government bond yield (6.8%) to estimate future growth. In the same way as with the 10-year 'growth' period, we discount future cash flows to today's value, using a cost of equity of 18%.
Terminal Value (TV)= FCF2032 × (1 + g) ÷ (r – g) = ₹13m× (1 + 6.8%) ÷ (18%– 6.8%) = ₹120m
Present Value of Terminal Value (PVTV)= TV / (1 + r)10= ₹120m÷ ( 1 + 18%)10= ₹23m
The total value, or equity value, is then the sum of the present value of the future cash flows, which in this case is ₹49m. The last step is to then divide the equity value by the number of shares outstanding. Relative to the current share price of ₹1.6, the company appears around fair value at the time of writing. Valuations are imprecise instruments though, rather like a telescope - move a few degrees and end up in a different galaxy. Do keep this in mind.
Important Assumptions
Now the most important inputs to a discounted cash flow are the discount rate, and of course, the actual cash flows. If you don't agree with these result, have a go at the calculation yourself and play with the assumptions. The DCF also does not consider the possible cyclicality of an industry, or a company's future capital requirements, so it does not give a full picture of a company's potential performance. Given that we are looking at Sri Adhikari Brothers Television Network as potential shareholders, the cost of equity is used as the discount rate, rather than the cost of capital (or weighted average cost of capital, WACC) which accounts for debt. In this calculation we've used 18%, which is based on a levered beta of 1.176. Beta is a measure of a stock's volatility, compared to the market as a whole. We get our beta from the industry average beta of globally comparable companies, with an imposed limit between 0.8 and 2.0, which is a reasonable range for a stable business.
SWOT Analysis for Sri Adhikari Brothers Television Network
- No major strengths identified for SABTN.
- Current share price is above our estimate of fair value.
- Has sufficient cash runway for more than 3 years based on current free cash flows.
- Lack of analyst coverage makes it difficult to determine SABTN's earnings prospects.
- Debt is not well covered by operating cash flow.
- Total liabilities exceed total assets, which raises the risk of financial distress.
Looking Ahead:
Although the valuation of a company is important, it shouldn't be the only metric you look at when researching a company. The DCF model is not a perfect stock valuation tool. Preferably you'd apply different cases and assumptions and see how they would impact the company's valuation. For example, changes in the company's cost of equity or the risk free rate can significantly impact the valuation. For Sri Adhikari Brothers Television Network, we've put together three further items you should look at:
- Risks: Take risks, for example - Sri Adhikari Brothers Television Network has 3 warning signs we think you should be aware of.
- Other Solid Businesses: Low debt, high returns on equity and good past performance are fundamental to a strong business. Why not explore our interactive list of stocks with solid business fundamentals to see if there are other companies you may not have considered!
- Other Environmentally-Friendly Companies: Concerned about the environment and think consumers will buy eco-friendly products more and more? Browse through our interactive list of companies that are thinking about a greener future to discover some stocks you may not have thought of!
PS. The Simply Wall St app conducts a discounted cash flow valuation for every stock on the NSEI every day. If you want to find the calculation for other stocks just search here.
New: Manage All Your Stock Portfolios in One Place
We've created the ultimate portfolio companion for stock investors, and it's free.
• Connect an unlimited number of Portfolios and see your total in one currency
• Be alerted to new Warning Signs or Risks via email or mobile
• Track the Fair Value of your stocks
Have feedback on this article? Concerned about the content? Get in touch with us directly. Alternatively, email editorial-team (at) simplywallst.com.
This article by Simply Wall St is general in nature. We provide commentary based on historical data and analyst forecasts only using an unbiased methodology and our articles are not intended to be financial advice. It does not constitute a recommendation to buy or sell any stock, and does not take account of your objectives, or your financial situation. We aim to bring you long-term focused analysis driven by fundamental data. Note that our analysis may not factor in the latest price-sensitive company announcements or qualitative material. Simply Wall St has no position in any stocks mentioned.
About NSEI:SABTNL
Sri Adhikari Brothers Television Network
Engages in the content production and distribution businesses in India.
Slight with imperfect balance sheet.
Market Insights

Community Narratives


