
Advertisement
Here's How P/E Ratios Can Help Us Understand Brightcom Group Limited (NSE:BCG)

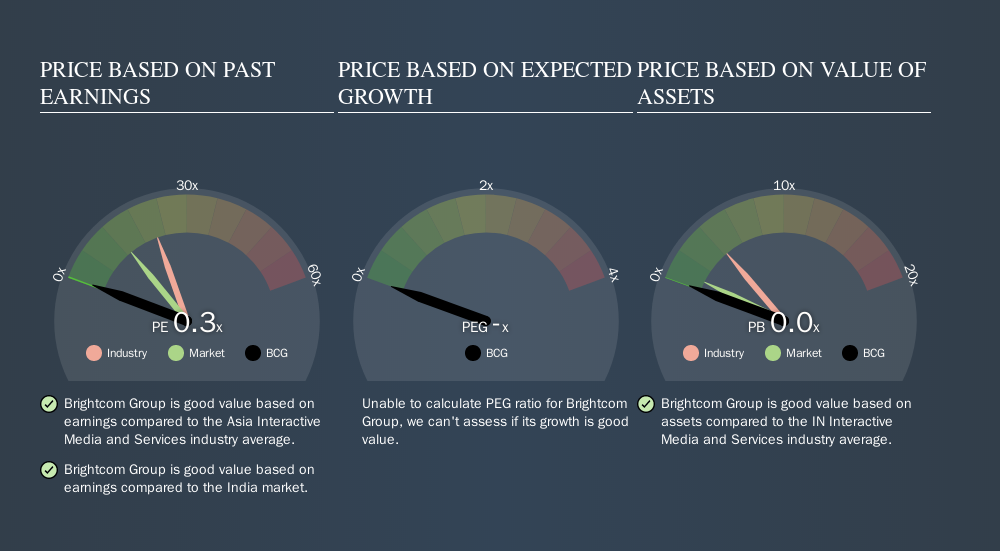
This article is written for those who want to get better at using price to earnings ratios (P/E ratios). We'll look at Brightcom Group Limited's (NSE:BCG) P/E ratio and reflect on what it tells us about the company's share price. Brightcom Group has a P/E ratio of 0.34, based on the last twelve months. That means that at current prices, buyers pay ₹0.34 for every ₹1 in trailing yearly profits.
Check out our latest analysis for Brightcom Group
How Do I Calculate A Price To Earnings Ratio?
The formula for price to earnings is:
Price to Earnings Ratio = Price per Share ÷ Earnings per Share (EPS)
Or for Brightcom Group:
P/E of 0.34 = ₹3.09 ÷ ₹9.15 (Based on the year to June 2019.)
Is A High P/E Ratio Good?
A higher P/E ratio means that buyers have to pay a higher price for each ₹1 the company has earned over the last year. That is not a good or a bad thing per se, but a high P/E does imply buyers are optimistic about the future.
How Does Brightcom Group's P/E Ratio Compare To Its Peers?
The P/E ratio indicates whether the market has higher or lower expectations of a company. The image below shows that Brightcom Group has a lower P/E than the average (21.6) P/E for companies in the interactive media and services industry.
Brightcom Group's P/E tells us that market participants think it will not fare as well as its peers in the same industry. Since the market seems unimpressed with Brightcom Group, it's quite possible it could surprise on the upside. It is arguably worth checking if insiders are buying shares, because that might imply they believe the stock is undervalued.
How Growth Rates Impact P/E Ratios
Earnings growth rates have a big influence on P/E ratios. If earnings are growing quickly, then the 'E' in the equation will increase faster than it would otherwise. Therefore, even if you pay a high multiple of earnings now, that multiple will become lower in the future. And as that P/E ratio drops, the company will look cheap, unless its share price increases.
Brightcom Group saw earnings per share improve by -4.7% last year. And its annual EPS growth rate over 5 years is 12%.
A Limitation: P/E Ratios Ignore Debt and Cash In The Bank
It's important to note that the P/E ratio considers the market capitalization, not the enterprise value. That means it doesn't take debt or cash into account. Theoretically, a business can improve its earnings (and produce a lower P/E in the future) by investing in growth. That means taking on debt (or spending its cash).
While growth expenditure doesn't always pay off, the point is that it is a good option to have; but one that the P/E ratio ignores.
Brightcom Group's Balance Sheet
With net cash of ₹356m, Brightcom Group has a very strong balance sheet, which may be important for its business. Having said that, at 24% of its market capitalization the cash hoard would contribute towards a higher P/E ratio.
The Verdict On Brightcom Group's P/E Ratio
Brightcom Group trades on a P/E ratio of 0.3, which is below the IN market average of 13.1. EPS was up modestly better over the last twelve months. And the net cash position gives the company many options. So it's strange that the low P/E indicates low expectations.
Investors should be looking to buy stocks that the market is wrong about. As value investor Benjamin Graham famously said, 'In the short run, the market is a voting machine but in the long run, it is a weighing machine. Although we don't have analyst forecasts you could get a better understanding of its growth by checking out this more detailed historical graph of earnings, revenue and cash flow.
Of course, you might find a fantastic investment by looking at a few good candidates. So take a peek at this free list of companies with modest (or no) debt, trading on a P/E below 20.
We aim to bring you long-term focused research analysis driven by fundamental data. Note that our analysis may not factor in the latest price-sensitive company announcements or qualitative material.
If you spot an error that warrants correction, please contact the editor at editorial-team@simplywallst.com. This article by Simply Wall St is general in nature. It does not constitute a recommendation to buy or sell any stock, and does not take account of your objectives, or your financial situation. Simply Wall St has no position in the stocks mentioned. Thank you for reading.
About NSEI:BCG
Brightcom Group
Provides digital marketing solutions to businesses, agencies, and online publishers worldwide.
Flawless balance sheet and slightly overvalued.
Market Insights


Advertisement
Community Narratives
For the Emperor: Why Games Workshop Could Be a Star Investment
Fair Value UK£160.00|0.5% overvalued
RO
Community Contributor
Securitas will boost margins with AI and tech-driven services
Fair Value SEK 260.91|44.9% undervalued
UN
Community Contributor
A Leader in EV Charging with Growth Potential
Fair Value €27.00|21.3% undervalued
TI
Community Contributor