
Advertisement
- India
- /
- Metals and Mining
- /
- NSEI:WELCORP
Is There An Opportunity With Welspun Corp Limited's (NSE:WELCORP) 46% Undervaluation?
Key Insights
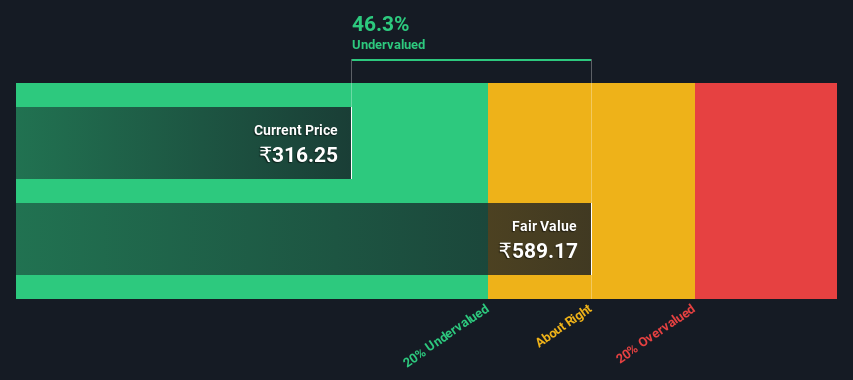
- The projected fair value for Welspun is ₹589 based on 2 Stage Free Cash Flow to Equity
- Current share price of ₹316 suggests Welspun is potentially 46% undervalued
- Analyst price target for WELCORP is ₹377 which is 36% below our fair value estimate
Does the August share price for Welspun Corp Limited (NSE:WELCORP) reflect what it's really worth? Today, we will estimate the stock's intrinsic value by estimating the company's future cash flows and discounting them to their present value. Our analysis will employ the Discounted Cash Flow (DCF) model. Don't get put off by the jargon, the math behind it is actually quite straightforward.
Companies can be valued in a lot of ways, so we would point out that a DCF is not perfect for every situation. If you want to learn more about discounted cash flow, the rationale behind this calculation can be read in detail in the Simply Wall St analysis model.
See our latest analysis for Welspun
Is Welspun Fairly Valued?
We're using the 2-stage growth model, which simply means we take in account two stages of company's growth. In the initial period the company may have a higher growth rate and the second stage is usually assumed to have a stable growth rate. To begin with, we have to get estimates of the next ten years of cash flows. Where possible we use analyst estimates, but when these aren't available we extrapolate the previous free cash flow (FCF) from the last estimate or reported value. We assume companies with shrinking free cash flow will slow their rate of shrinkage, and that companies with growing free cash flow will see their growth rate slow, over this period. We do this to reflect that growth tends to slow more in the early years than it does in later years.
A DCF is all about the idea that a dollar in the future is less valuable than a dollar today, so we need to discount the sum of these future cash flows to arrive at a present value estimate:
10-year free cash flow (FCF) forecast
| 2024 | 2025 | 2026 | 2027 | 2028 | 2029 | 2030 | 2031 | 2032 | 2033 | |
| Levered FCF (₹, Millions) | ₹8.79b | ₹12.7b | ₹15.9b | ₹19.0b | ₹22.1b | ₹25.0b | ₹27.8b | ₹30.5b | ₹33.3b | ₹36.0b |
| Growth Rate Estimate Source | Analyst x1 | Analyst x1 | Est @ 25.40% | Est @ 19.81% | Est @ 15.89% | Est @ 13.15% | Est @ 11.23% | Est @ 9.89% | Est @ 8.95% | Est @ 8.29% |
| Present Value (₹, Millions) Discounted @ 18% | ₹7.5k | ₹9.1k | ₹9.7k | ₹9.9k | ₹9.7k | ₹9.3k | ₹8.8k | ₹8.2k | ₹7.6k | ₹7.0k |
("Est" = FCF growth rate estimated by Simply Wall St)
Present Value of 10-year Cash Flow (PVCF) = ₹87b
The second stage is also known as Terminal Value, this is the business's cash flow after the first stage. The Gordon Growth formula is used to calculate Terminal Value at a future annual growth rate equal to the 5-year average of the 10-year government bond yield of 6.8%. We discount the terminal cash flows to today's value at a cost of equity of 18%.
Terminal Value (TV)= FCF2033 × (1 + g) ÷ (r – g) = ₹36b× (1 + 6.8%) ÷ (18%– 6.8%) = ₹347b
Present Value of Terminal Value (PVTV)= TV / (1 + r)10= ₹347b÷ ( 1 + 18%)10= ₹67b
The total value, or equity value, is then the sum of the present value of the future cash flows, which in this case is ₹154b. In the final step we divide the equity value by the number of shares outstanding. Compared to the current share price of ₹316, the company appears quite undervalued at a 46% discount to where the stock price trades currently. Remember though, that this is just an approximate valuation, and like any complex formula - garbage in, garbage out.
The Assumptions
We would point out that the most important inputs to a discounted cash flow are the discount rate and of course the actual cash flows. Part of investing is coming up with your own evaluation of a company's future performance, so try the calculation yourself and check your own assumptions. The DCF also does not consider the possible cyclicality of an industry, or a company's future capital requirements, so it does not give a full picture of a company's potential performance. Given that we are looking at Welspun as potential shareholders, the cost of equity is used as the discount rate, rather than the cost of capital (or weighted average cost of capital, WACC) which accounts for debt. In this calculation we've used 18%, which is based on a levered beta of 1.330. Beta is a measure of a stock's volatility, compared to the market as a whole. We get our beta from the industry average beta of globally comparable companies, with an imposed limit between 0.8 and 2.0, which is a reasonable range for a stable business.
SWOT Analysis for Welspun
Strength
- Debt is well covered by .
- Dividend is in the top 25% of dividend payers in the market.
Weakness
- Earnings growth over the past year underperformed the Metals and Mining industry.
- Interest payments on debt are not well covered.
Opportunity
- Annual earnings are forecast to grow faster than the Indian market.
- Good value based on P/E ratio and estimated fair value.
Threat
- Debt is not well covered by operating cash flow.
- Paying a dividend but company has no free cash flows.
- Revenue is forecast to grow slower than 20% per year.
Next Steps:
Valuation is only one side of the coin in terms of building your investment thesis, and it is only one of many factors that you need to assess for a company. DCF models are not the be-all and end-all of investment valuation. Instead the best use for a DCF model is to test certain assumptions and theories to see if they would lead to the company being undervalued or overvalued. For instance, if the terminal value growth rate is adjusted slightly, it can dramatically alter the overall result. What is the reason for the share price sitting below the intrinsic value? For Welspun, we've compiled three pertinent factors you should assess:
- Risks: Case in point, we've spotted 4 warning signs for Welspun you should be aware of.
- Future Earnings: How does WELCORP's growth rate compare to its peers and the wider market? Dig deeper into the analyst consensus number for the upcoming years by interacting with our free analyst growth expectation chart.
- Other Solid Businesses: Low debt, high returns on equity and good past performance are fundamental to a strong business. Why not explore our interactive list of stocks with solid business fundamentals to see if there are other companies you may not have considered!
PS. Simply Wall St updates its DCF calculation for every Indian stock every day, so if you want to find the intrinsic value of any other stock just search here.
Valuation is complex, but we're here to simplify it.
Discover if Welspun might be undervalued or overvalued with our detailed analysis, featuring fair value estimates, potential risks, dividends, insider trades, and its financial condition.
Access Free AnalysisHave feedback on this article? Concerned about the content? Get in touch with us directly. Alternatively, email editorial-team (at) simplywallst.com.
This article by Simply Wall St is general in nature. We provide commentary based on historical data and analyst forecasts only using an unbiased methodology and our articles are not intended to be financial advice. It does not constitute a recommendation to buy or sell any stock, and does not take account of your objectives, or your financial situation. We aim to bring you long-term focused analysis driven by fundamental data. Note that our analysis may not factor in the latest price-sensitive company announcements or qualitative material. Simply Wall St has no position in any stocks mentioned.
About NSEI:WELCORP
Welspun
Manufactures, trades in, distributes, and sells steel pipes, tubes, bars, coils, and plates in India, the United States, and internationally.
Solid track record with excellent balance sheet.
Similar Companies
Market Insights

Advertisement
Community Narratives
The company that turned a verb into a global necessity and basically runs the modern internet, digital ads, smartphones, maps, and AI.
Fair Value US$300.00|6.3% undervalued
OS
Community Contributor
Flowers Foods Pays A Fair Price For Health
Fair Value US$16.12|26.0% undervalued
NV
Community Contributor
TMX Group will thrive with 33.3% profit margin and enduring market moat
Fair Value CA$49.90|3.7% overvalued
LI
Community Contributor