- India
- /
- Basic Materials
- /
- NSEI:VISAKAIND
Market Cool On Visaka Industries Limited's (NSE:VISAKAIND) Revenues Pushing Shares 27% Lower

Visaka Industries Limited (NSE:VISAKAIND) shares have retraced a considerable 27% in the last month, reversing a fair amount of their solid recent performance. Looking at the bigger picture, even after this poor month the stock is up 48% in the last year.
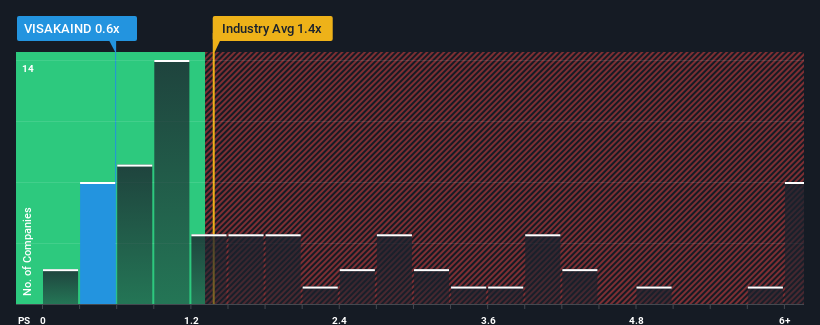
Even after such a large drop in price, given about half the companies operating in India's Basic Materials industry have price-to-sales ratios (or "P/S") above 1.4x, you may still consider Visaka Industries as an attractive investment with its 0.6x P/S ratio. Nonetheless, we'd need to dig a little deeper to determine if there is a rational basis for the reduced P/S.
View our latest analysis for Visaka Industries
How Has Visaka Industries Performed Recently?
For example, consider that Visaka Industries' financial performance has been poor lately as its revenue has been in decline. Perhaps the market believes the recent revenue performance isn't good enough to keep up the industry, causing the P/S ratio to suffer. If you like the company, you'd be hoping this isn't the case so that you could potentially pick up some stock while it's out of favour.
We don't have analyst forecasts, but you can see how recent trends are setting up the company for the future by checking out our free report on Visaka Industries' earnings, revenue and cash flow.Is There Any Revenue Growth Forecasted For Visaka Industries?
Visaka Industries' P/S ratio would be typical for a company that's only expected to deliver limited growth, and importantly, perform worse than the industry.
Retrospectively, the last year delivered a frustrating 2.3% decrease to the company's top line. Even so, admirably revenue has lifted 55% in aggregate from three years ago, notwithstanding the last 12 months. Although it's been a bumpy ride, it's still fair to say the revenue growth recently has been more than adequate for the company.
Weighing the recent medium-term upward revenue trajectory against the broader industry's one-year forecast for contraction of 12% shows it's a great look while it lasts.
In light of this, it's quite peculiar that Visaka Industries' P/S sits below the majority of other companies. Apparently some shareholders believe the recent performance has exceeded its limits and have been accepting significantly lower selling prices.
The Bottom Line On Visaka Industries' P/S
The southerly movements of Visaka Industries' shares means its P/S is now sitting at a pretty low level. While the price-to-sales ratio shouldn't be the defining factor in whether you buy a stock or not, it's quite a capable barometer of revenue expectations.
Our examination of Visaka Industries revealed that despite growing revenue over the medium-term in a shrinking industry, the P/S doesn't reflect this as it's lower than the industry average. There could be some major unobserved threats to revenue preventing the P/S ratio from matching this positive performance. The most obvious risk is that its revenue trajectory may not keep outperforming under these tough industry conditions. At least the risk of a price drop looks to be subdued, but investors think future revenue could see a lot of volatility.
Having said that, be aware Visaka Industries is showing 5 warning signs in our investment analysis, and 4 of those don't sit too well with us.
Of course, profitable companies with a history of great earnings growth are generally safer bets. So you may wish to see this free collection of other companies that have reasonable P/E ratios and have grown earnings strongly.
If you're looking to trade Visaka Industries, open an account with the lowest-cost platform trusted by professionals, Interactive Brokers.
With clients in over 200 countries and territories, and access to 160 markets, IBKR lets you trade stocks, options, futures, forex, bonds and funds from a single integrated account.
Enjoy no hidden fees, no account minimums, and FX conversion rates as low as 0.03%, far better than what most brokers offer.
Sponsored ContentNew: Manage All Your Stock Portfolios in One Place
We've created the ultimate portfolio companion for stock investors, and it's free.
• Connect an unlimited number of Portfolios and see your total in one currency
• Be alerted to new Warning Signs or Risks via email or mobile
• Track the Fair Value of your stocks
Have feedback on this article? Concerned about the content? Get in touch with us directly. Alternatively, email editorial-team (at) simplywallst.com.
This article by Simply Wall St is general in nature. We provide commentary based on historical data and analyst forecasts only using an unbiased methodology and our articles are not intended to be financial advice. It does not constitute a recommendation to buy or sell any stock, and does not take account of your objectives, or your financial situation. We aim to bring you long-term focused analysis driven by fundamental data. Note that our analysis may not factor in the latest price-sensitive company announcements or qualitative material. Simply Wall St has no position in any stocks mentioned.
About NSEI:VISAKAIND
Visaka Industries
Manufactures and sells corrugated cement fiber sheets in India and internationally.
Slight and slightly overvalued.
Market Insights

Community Narratives

