

The market was pleased with the recent earnings report from Vedanta Limited (NSE:VEDL), despite the profit numbers being soft. Our analysis suggests that investors may have noticed some promising signs beyond the statutory profit figures.
See our latest analysis for Vedanta
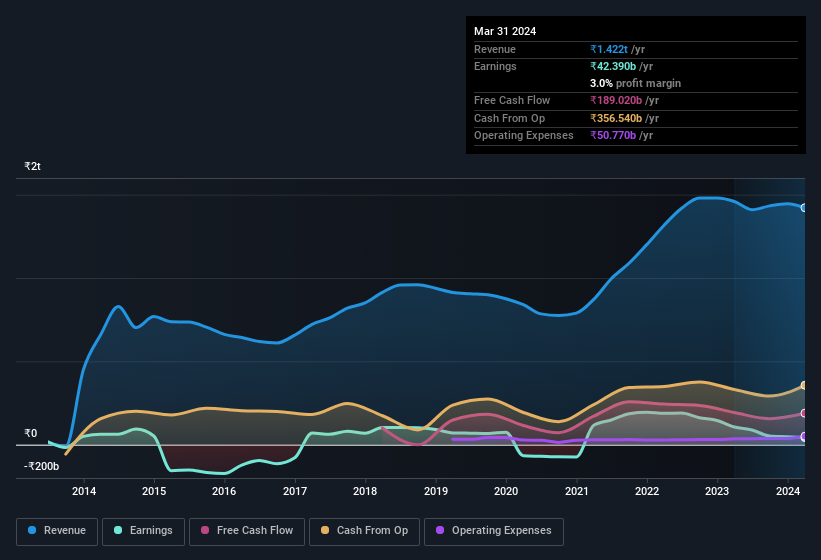
Zooming In On Vedanta's Earnings
As finance nerds would already know, the accrual ratio from cashflow is a key measure for assessing how well a company's free cash flow (FCF) matches its profit. To get the accrual ratio we first subtract FCF from profit for a period, and then divide that number by the average operating assets for the period. You could think of the accrual ratio from cashflow as the 'non-FCF profit ratio'.
As a result, a negative accrual ratio is a positive for the company, and a positive accrual ratio is a negative. While it's not a problem to have a positive accrual ratio, indicating a certain level of non-cash profits, a high accrual ratio is arguably a bad thing, because it indicates paper profits are not matched by cash flow. To quote a 2014 paper by Lewellen and Resutek, "firms with higher accruals tend to be less profitable in the future".
Over the twelve months to March 2024, Vedanta recorded an accrual ratio of -0.15. That indicates that its free cash flow quite significantly exceeded its statutory profit. In fact, it had free cash flow of ₹189b in the last year, which was a lot more than its statutory profit of ₹42.4b. Over the last year, Vedanta's free cash flow remained steady. However, that's not all there is to consider. The accrual ratio is reflecting the impact of unusual items on statutory profit, at least in part.
That might leave you wondering what analysts are forecasting in terms of future profitability. Luckily, you can click here to see an interactive graph depicting future profitability, based on their estimates.
The Impact Of Unusual Items On Profit
While the accrual ratio might bode well, we also note that Vedanta's profit was boosted by unusual items worth ₹30b in the last twelve months. We can't deny that higher profits generally leave us optimistic, but we'd prefer it if the profit were to be sustainable. When we analysed the vast majority of listed companies worldwide, we found that significant unusual items are often not repeated. And, after all, that's exactly what the accounting terminology implies. Assuming those unusual items don't show up again in the current year, we'd thus expect profit to be weaker next year (in the absence of business growth, that is).
Our Take On Vedanta's Profit Performance
Vedanta's profits got a boost from unusual items, which indicates they might not be sustained and yet its accrual ratio still indicated solid cash conversion, which is promising. After taking into account all these factors, we think that Vedanta's statutory results are a decent reflection of its underlying earnings power. In light of this, if you'd like to do more analysis on the company, it's vital to be informed of the risks involved. In terms of investment risks, we've identified 3 warning signs with Vedanta, and understanding them should be part of your investment process.
In this article we've looked at a number of factors that can impair the utility of profit numbers, as a guide to a business. But there are plenty of other ways to inform your opinion of a company. For example, many people consider a high return on equity as an indication of favorable business economics, while others like to 'follow the money' and search out stocks that insiders are buying. While it might take a little research on your behalf, you may find this free collection of companies boasting high return on equity, or this list of stocks with significant insider holdings to be useful.
New: Manage All Your Stock Portfolios in One Place
We've created the ultimate portfolio companion for stock investors, and it's free.
• Connect an unlimited number of Portfolios and see your total in one currency
• Be alerted to new Warning Signs or Risks via email or mobile
• Track the Fair Value of your stocks
Have feedback on this article? Concerned about the content? Get in touch with us directly. Alternatively, email editorial-team (at) simplywallst.com.
This article by Simply Wall St is general in nature. We provide commentary based on historical data and analyst forecasts only using an unbiased methodology and our articles are not intended to be financial advice. It does not constitute a recommendation to buy or sell any stock, and does not take account of your objectives, or your financial situation. We aim to bring you long-term focused analysis driven by fundamental data. Note that our analysis may not factor in the latest price-sensitive company announcements or qualitative material. Simply Wall St has no position in any stocks mentioned.
Have feedback on this article? Concerned about the content? Get in touch with us directly. Alternatively, email editorial-team@simplywallst.com
About NSEI:VEDL
Vedanta
A diversified natural resources company, explores, extracts, and processes minerals, and oil and gas in India, Europe, China, the United States, Mexico, and internationally.
Very undervalued with solid track record and pays a dividend.
Market Insights

Community Narratives

