A Look At The Fair Value Of Tamilnadu Petroproducts Limited (NSE:TNPETRO)


Key Insights
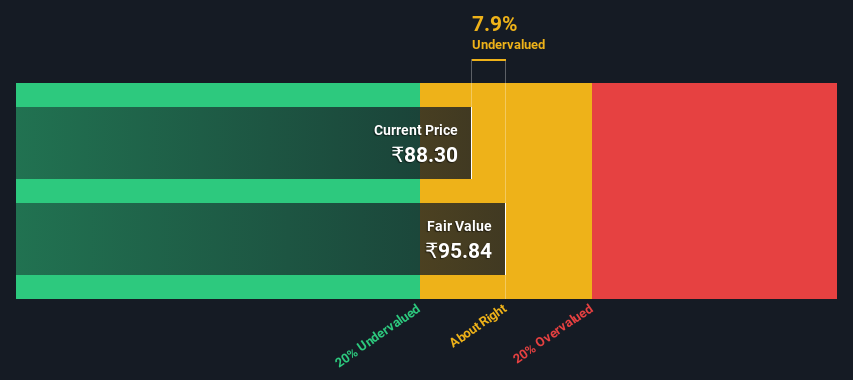
- The projected fair value for Tamilnadu Petroproducts is ₹95.84 based on 2 Stage Free Cash Flow to Equity
- Current share price of ₹88.30 suggests Tamilnadu Petroproducts is potentially trading close to its fair value
- Tamilnadu Petroproducts' peers are currently trading at a premium of 591% on average
Today we'll do a simple run through of a valuation method used to estimate the attractiveness of Tamilnadu Petroproducts Limited (NSE:TNPETRO) as an investment opportunity by taking the forecast future cash flows of the company and discounting them back to today's value. We will take advantage of the Discounted Cash Flow (DCF) model for this purpose. There's really not all that much to it, even though it might appear quite complex.
We would caution that there are many ways of valuing a company and, like the DCF, each technique has advantages and disadvantages in certain scenarios. If you want to learn more about discounted cash flow, the rationale behind this calculation can be read in detail in the Simply Wall St analysis model.
View our latest analysis for Tamilnadu Petroproducts
Step By Step Through The Calculation
We are going to use a two-stage DCF model, which, as the name states, takes into account two stages of growth. The first stage is generally a higher growth period which levels off heading towards the terminal value, captured in the second 'steady growth' period. To begin with, we have to get estimates of the next ten years of cash flows. Seeing as no analyst estimates of free cash flow are available to us, we have extrapolate the previous free cash flow (FCF) from the company's last reported value. We assume companies with shrinking free cash flow will slow their rate of shrinkage, and that companies with growing free cash flow will see their growth rate slow, over this period. We do this to reflect that growth tends to slow more in the early years than it does in later years.
A DCF is all about the idea that a dollar in the future is less valuable than a dollar today, and so the sum of these future cash flows is then discounted to today's value:
10-year free cash flow (FCF) forecast
| 2024 | 2025 | 2026 | 2027 | 2028 | 2029 | 2030 | 2031 | 2032 | 2033 | |
| Levered FCF (₹, Millions) | ₹599.0m | ₹659.8m | ₹719.9m | ₹780.3m | ₹841.8m | ₹905.3m | ₹971.2m | ₹1.04b | ₹1.11b | ₹1.19b |
| Growth Rate Estimate Source | Est @ 11.61% | Est @ 10.14% | Est @ 9.11% | Est @ 8.39% | Est @ 7.89% | Est @ 7.53% | Est @ 7.29% | Est @ 7.11% | Est @ 6.99% | Est @ 6.91% |
| Present Value (₹, Millions) Discounted @ 14% | ₹524 | ₹505 | ₹482 | ₹458 | ₹432 | ₹407 | ₹382 | ₹358 | ₹335 | ₹313 |
("Est" = FCF growth rate estimated by Simply Wall St)
Present Value of 10-year Cash Flow (PVCF) = ₹4.2b
We now need to calculate the Terminal Value, which accounts for all the future cash flows after this ten year period. For a number of reasons a very conservative growth rate is used that cannot exceed that of a country's GDP growth. In this case we have used the 5-year average of the 10-year government bond yield (6.7%) to estimate future growth. In the same way as with the 10-year 'growth' period, we discount future cash flows to today's value, using a cost of equity of 14%.
Terminal Value (TV)= FCF2033 × (1 + g) ÷ (r – g) = ₹1.2b× (1 + 6.7%) ÷ (14%– 6.7%) = ₹17b
Present Value of Terminal Value (PVTV)= TV / (1 + r)10= ₹17b÷ ( 1 + 14%)10= ₹4.4b
The total value is the sum of cash flows for the next ten years plus the discounted terminal value, which results in the Total Equity Value, which in this case is ₹8.6b. The last step is to then divide the equity value by the number of shares outstanding. Compared to the current share price of ₹88.3, the company appears about fair value at a 7.9% discount to where the stock price trades currently. The assumptions in any calculation have a big impact on the valuation, so it is better to view this as a rough estimate, not precise down to the last cent.
The Assumptions
The calculation above is very dependent on two assumptions. The first is the discount rate and the other is the cash flows. If you don't agree with these result, have a go at the calculation yourself and play with the assumptions. The DCF also does not consider the possible cyclicality of an industry, or a company's future capital requirements, so it does not give a full picture of a company's potential performance. Given that we are looking at Tamilnadu Petroproducts as potential shareholders, the cost of equity is used as the discount rate, rather than the cost of capital (or weighted average cost of capital, WACC) which accounts for debt. In this calculation we've used 14%, which is based on a levered beta of 0.968. Beta is a measure of a stock's volatility, compared to the market as a whole. We get our beta from the industry average beta of globally comparable companies, with an imposed limit between 0.8 and 2.0, which is a reasonable range for a stable business.
SWOT Analysis for Tamilnadu Petroproducts
- Debt is not viewed as a risk.
- Dividend is in the top 25% of dividend payers in the market.
- Earnings declined over the past year.
- Current share price is below our estimate of fair value.
- Lack of analyst coverage makes it difficult to determine TNPETRO's earnings prospects.
- Dividends are not covered by cash flow.
Looking Ahead:
Whilst important, the DCF calculation is only one of many factors that you need to assess for a company. The DCF model is not a perfect stock valuation tool. Instead the best use for a DCF model is to test certain assumptions and theories to see if they would lead to the company being undervalued or overvalued. For example, changes in the company's cost of equity or the risk free rate can significantly impact the valuation. For Tamilnadu Petroproducts, we've put together three relevant factors you should look at:
- Risks: For instance, we've identified 3 warning signs for Tamilnadu Petroproducts that you should be aware of.
- Other Solid Businesses: Low debt, high returns on equity and good past performance are fundamental to a strong business. Why not explore our interactive list of stocks with solid business fundamentals to see if there are other companies you may not have considered!
- Other Environmentally-Friendly Companies: Concerned about the environment and think consumers will buy eco-friendly products more and more? Browse through our interactive list of companies that are thinking about a greener future to discover some stocks you may not have thought of!
PS. Simply Wall St updates its DCF calculation for every Indian stock every day, so if you want to find the intrinsic value of any other stock just search here.
Valuation is complex, but we're here to simplify it.
Discover if Tamilnadu Petroproducts might be undervalued or overvalued with our detailed analysis, featuring fair value estimates, potential risks, dividends, insider trades, and its financial condition.
Access Free AnalysisHave feedback on this article? Concerned about the content? Get in touch with us directly. Alternatively, email editorial-team (at) simplywallst.com.
This article by Simply Wall St is general in nature. We provide commentary based on historical data and analyst forecasts only using an unbiased methodology and our articles are not intended to be financial advice. It does not constitute a recommendation to buy or sell any stock, and does not take account of your objectives, or your financial situation. We aim to bring you long-term focused analysis driven by fundamental data. Note that our analysis may not factor in the latest price-sensitive company announcements or qualitative material. Simply Wall St has no position in any stocks mentioned.
About NSEI:TNPETRO
Tamilnadu Petroproducts
Manufactures and sells petrochemical and industrial intermediate chemical products in India.
Flawless balance sheet slight.
Market Insights

Community Narratives

