
Advertisement
- India
- /
- Metals and Mining
- /
- NSEI:SURYAROSNI
Declining Stock and Solid Fundamentals: Is The Market Wrong About Surya Roshni Limited (NSE:SURYAROSNI)?
Surya Roshni (NSE:SURYAROSNI) has had a rough month with its share price down 15%. However, a closer look at its sound financials might cause you to think again. Given that fundamentals usually drive long-term market outcomes, the company is worth looking at. In this article, we decided to focus on Surya Roshni's ROE.
Return on Equity or ROE is a test of how effectively a company is growing its value and managing investors’ money. In other words, it is a profitability ratio which measures the rate of return on the capital provided by the company's shareholders.
View our latest analysis for Surya Roshni
How Is ROE Calculated?
The formula for return on equity is:
Return on Equity = Net Profit (from continuing operations) ÷ Shareholders' Equity
So, based on the above formula, the ROE for Surya Roshni is:
15% = ₹3.3b ÷ ₹22b (Based on the trailing twelve months to March 2024).
The 'return' is the income the business earned over the last year. That means that for every ₹1 worth of shareholders' equity, the company generated ₹0.15 in profit.
Why Is ROE Important For Earnings Growth?
So far, we've learned that ROE is a measure of a company's profitability. Depending on how much of these profits the company reinvests or "retains", and how effectively it does so, we are then able to assess a company’s earnings growth potential. Assuming everything else remains unchanged, the higher the ROE and profit retention, the higher the growth rate of a company compared to companies that don't necessarily bear these characteristics.
A Side By Side comparison of Surya Roshni's Earnings Growth And 15% ROE
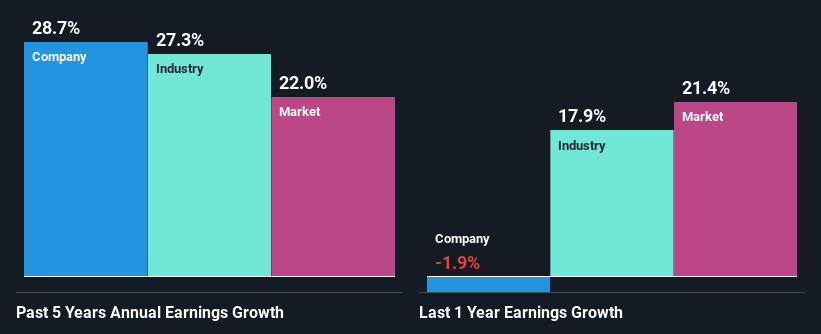
To begin with, Surya Roshni seems to have a respectable ROE. On comparing with the average industry ROE of 13% the company's ROE looks pretty remarkable. This certainly adds some context to Surya Roshni's exceptional 29% net income growth seen over the past five years. However, there could also be other causes behind this growth. For instance, the company has a low payout ratio or is being managed efficiently.
Next, on comparing Surya Roshni's net income growth with the industry, we found that the company's reported growth is similar to the industry average growth rate of 27% over the last few years.
Earnings growth is a huge factor in stock valuation. It’s important for an investor to know whether the market has priced in the company's expected earnings growth (or decline). Doing so will help them establish if the stock's future looks promising or ominous. If you're wondering about Surya Roshni's's valuation, check out this gauge of its price-to-earnings ratio, as compared to its industry.
Is Surya Roshni Using Its Retained Earnings Effectively?
Surya Roshni's three-year median payout ratio to shareholders is 11%, which is quite low. This implies that the company is retaining 89% of its profits. So it looks like Surya Roshni is reinvesting profits heavily to grow its business, which shows in its earnings growth.
Additionally, Surya Roshni has paid dividends over a period of at least ten years which means that the company is pretty serious about sharing its profits with shareholders.
Summary
Overall, we are quite pleased with Surya Roshni's performance. Specifically, we like that the company is reinvesting a huge chunk of its profits at a high rate of return. This of course has caused the company to see substantial growth in its earnings. That being so, a study of the latest analyst forecasts show that the company is expected to see a slowdown in its future earnings growth. To know more about the latest analysts predictions for the company, check out this visualization of analyst forecasts for the company.
New: Manage All Your Stock Portfolios in One Place
We've created the ultimate portfolio companion for stock investors, and it's free.
• Connect an unlimited number of Portfolios and see your total in one currency
• Be alerted to new Warning Signs or Risks via email or mobile
• Track the Fair Value of your stocks
Have feedback on this article? Concerned about the content? Get in touch with us directly. Alternatively, email editorial-team (at) simplywallst.com.
This article by Simply Wall St is general in nature. We provide commentary based on historical data and analyst forecasts only using an unbiased methodology and our articles are not intended to be financial advice. It does not constitute a recommendation to buy or sell any stock, and does not take account of your objectives, or your financial situation. We aim to bring you long-term focused analysis driven by fundamental data. Note that our analysis may not factor in the latest price-sensitive company announcements or qualitative material. Simply Wall St has no position in any stocks mentioned.
Have feedback on this article? Concerned about the content? Get in touch with us directly. Alternatively, email editorial-team@simplywallst.com
About NSEI:SURYAROSNI
Surya Roshni
Manufactures and sells steel pipes and strips, and lighting and consumer durables in India.
Flawless balance sheet 6 star dividend payer.
Similar Companies
Market Insights

Advertisement
Community Narratives
Finding The True Value Of A Logistics Powerhouse
Fair Value US$95.21|8.5% undervalued
NV
Community Contributor
Paradigm Biopharmaceuticals Will Lead Osteoarthritis Treatment with Zilosul's FDA Success
Fair Value AU$5.50|91.9% undervalued
AM
Community Contributor
Barrick Mining (ABX:CA): A Gold Hedge against a U.S. Shutdown
Fair Value CA$60.00|26.5% undervalued
GM
Community Contributor