
Advertisement
- India
- /
- Metals and Mining
- /
- NSEI:SUPREMEENG
Read This Before You Buy Supreme Engineering Limited (NSE:SUPREMEENG) Because Of Its P/E Ratio

This article is written for those who want to get better at using price to earnings ratios (P/E ratios). To keep it practical, we'll show how Supreme Engineering Limited's (NSE:SUPREMEENG) P/E ratio could help you assess the value on offer. Based on the last twelve months, Supreme Engineering's P/E ratio is 7.25. That means that at current prices, buyers pay ₹7.25 for every ₹1 in trailing yearly profits.
Check out our latest analysis for Supreme Engineering
How Do You Calculate A P/E Ratio?
The formula for price to earnings is:
Price to Earnings Ratio = Price per Share ÷ Earnings per Share (EPS)
Or for Supreme Engineering:
P/E of 7.25 = ₹23.5 ÷ ₹3.24 (Based on the trailing twelve months to September 2018.)
Is A High Price-to-Earnings Ratio Good?
A higher P/E ratio means that buyers have to pay a higher price for each ₹1 the company has earned over the last year. That isn't necessarily good or bad, but a high P/E implies relatively high expectations of what a company can achieve in the future.
How Growth Rates Impact P/E Ratios
P/E ratios primarily reflect market expectations around earnings growth rates. That's because companies that grow earnings per share quickly will rapidly increase the 'E' in the equation. That means even if the current P/E is high, it will reduce over time if the share price stays flat. So while a stock may look expensive based on past earnings, it could be cheap based on future earnings.
Supreme Engineering increased earnings per share by 3.3% last year. And earnings per share have improved by 38% annually, over the last five years.
How Does Supreme Engineering's P/E Ratio Compare To Its Peers?
We can get an indication of market expectations by looking at the P/E ratio. If you look at the image below, you can see Supreme Engineering has a lower P/E than the average (10.8) in the metals and mining industry classification.
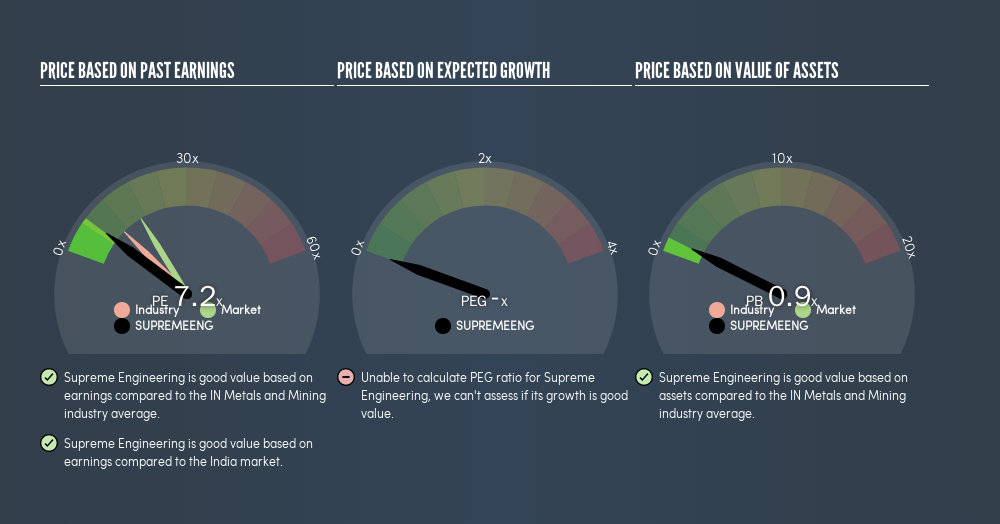
This suggests that market participants think Supreme Engineering will underperform other companies in its industry. Many investors like to buy stocks when the market is pessimistic about their prospects. It is arguably worth checking if insiders are buying shares, because that might imply they believe the stock is undervalued.
Remember: P/E Ratios Don't Consider The Balance Sheet
The 'Price' in P/E reflects the market capitalization of the company. Thus, the metric does not reflect cash or debt held by the company. Theoretically, a business can improve its earnings (and produce a lower P/E in the future), by taking on debt (or spending its remaining cash).
Such spending might be good or bad, overall, but the key point here is that you need to look at debt to understand the P/E ratio in context.
Is Debt Impacting Supreme Engineering's P/E?
Supreme Engineering's net debt is 69% of its market cap. If you want to compare its P/E ratio to other companies, you should absolutely keep in mind it has significant borrowings.
The Verdict On Supreme Engineering's P/E Ratio
Supreme Engineering has a P/E of 7.2. That's below the average in the IN market, which is 16.5. The meaningful debt load is probably contributing to low expectations, even though it has improved earnings recently.
Investors have an opportunity when market expectations about a stock are wrong. If it is underestimating a company, investors can make money by buying and holding the shares until the market corrects itself. We don't have analyst forecasts, but shareholders might want to examine this detailed historical graph of earnings, revenue and cash flow.
But note: Supreme Engineering may not be the best stock to buy. So take a peek at this freelist of interesting companies with strong recent earnings growth (and a P/E ratio below 20).
We aim to bring you long-term focused research analysis driven by fundamental data. Note that our analysis may not factor in the latest price-sensitive company announcements or qualitative material.
If you spot an error that warrants correction, please contact the editor at editorial-team@simplywallst.com. This article by Simply Wall St is general in nature. It does not constitute a recommendation to buy or sell any stock, and does not take account of your objectives, or your financial situation. Simply Wall St has no position in the stocks mentioned. Thank you for reading.
About NSEI:SUPREMEENG
Supreme Engineering
Engages in the manufacture and sale of steel products in India.
Slight with imperfect balance sheet.
Similar Companies
Market Insights

Advertisement
Community Narratives
Groundbreaking therapies that could change the treatment landscape for PTSD, fibromyalgia, MS & Alzheimer’s
Fair Value US$6.20|86.8% undervalued
CM
Community Contributor
DigitalOcean Will Grow 14% by Embracing AI with Paperspace Acquisition
Fair Value US$50.00|43.5% undervalued
NE
Community Contributor
Viant Technology: A Rising AdTech Challenger in the AI-Powered CTV Market
Fair Value US$38.61|61.4% undervalued
BL
Community Contributor
Volvo will Accelerate Forward into Electric and Autonomous Leadership in Five Years
Fair Value SEK 438.80|40.9% undervalued
UN
Community Contributor