- India
- /
- Basic Materials
- /
- NSEI:SPRL
SP Refractories Limited's (NSE:SPRL) Stock Has Shown Weakness Lately But Financial Prospects Look Decent: Is The Market Wrong?

SP Refractories (NSE:SPRL) has had a rough month with its share price down 13%. However, stock prices are usually driven by a company’s financials over the long term, which in this case look pretty respectable. In this article, we decided to focus on SP Refractories' ROE.
Return on equity or ROE is an important factor to be considered by a shareholder because it tells them how effectively their capital is being reinvested. In other words, it is a profitability ratio which measures the rate of return on the capital provided by the company's shareholders.
View our latest analysis for SP Refractories
How To Calculate Return On Equity?
The formula for ROE is:
Return on Equity = Net Profit (from continuing operations) ÷ Shareholders' Equity
So, based on the above formula, the ROE for SP Refractories is:
3.8% = ₹3.2m ÷ ₹85m (Based on the trailing twelve months to September 2022).
The 'return' refers to a company's earnings over the last year. One way to conceptualize this is that for each ₹1 of shareholders' capital it has, the company made ₹0.04 in profit.
What Is The Relationship Between ROE And Earnings Growth?
So far, we've learned that ROE is a measure of a company's profitability. We now need to evaluate how much profit the company reinvests or "retains" for future growth which then gives us an idea about the growth potential of the company. Generally speaking, other things being equal, firms with a high return on equity and profit retention, have a higher growth rate than firms that don’t share these attributes.
SP Refractories' Earnings Growth And 3.8% ROE
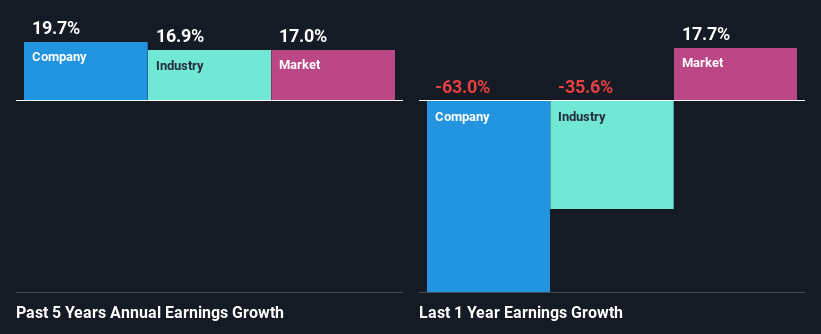
It is quite clear that SP Refractories' ROE is rather low. Even when compared to the industry average of 7.3%, the ROE figure is pretty disappointing. SP Refractories was still able to see a decent net income growth of 20% over the past five years. We believe that there might be other aspects that are positively influencing the company's earnings growth. Such as - high earnings retention or an efficient management in place.
As a next step, we compared SP Refractories' net income growth with the industry and found that the company has a similar growth figure when compared with the industry average growth rate of 17% in the same period.
Earnings growth is a huge factor in stock valuation. It’s important for an investor to know whether the market has priced in the company's expected earnings growth (or decline). Doing so will help them establish if the stock's future looks promising or ominous. If you're wondering about SP Refractories''s valuation, check out this gauge of its price-to-earnings ratio, as compared to its industry.
Is SP Refractories Making Efficient Use Of Its Profits?
Given that SP Refractories doesn't pay any dividend to its shareholders, we infer that the company has been reinvesting all of its profits to grow its business.
Conclusion
In total, it does look like SP Refractories has some positive aspects to its business. Even in spite of the low rate of return, the company has posted impressive earnings growth as a result of reinvesting heavily into its business. While we won't completely dismiss the company, what we would do, is try to ascertain how risky the business is to make a more informed decision around the company. To know the 6 risks we have identified for SP Refractories visit our risks dashboard for free.
If you're looking to trade SP Refractories, open an account with the lowest-cost platform trusted by professionals, Interactive Brokers.
With clients in over 200 countries and territories, and access to 160 markets, IBKR lets you trade stocks, options, futures, forex, bonds and funds from a single integrated account.
Enjoy no hidden fees, no account minimums, and FX conversion rates as low as 0.03%, far better than what most brokers offer.
Sponsored ContentNew: Manage All Your Stock Portfolios in One Place
We've created the ultimate portfolio companion for stock investors, and it's free.
• Connect an unlimited number of Portfolios and see your total in one currency
• Be alerted to new Warning Signs or Risks via email or mobile
• Track the Fair Value of your stocks
Have feedback on this article? Concerned about the content? Get in touch with us directly. Alternatively, email editorial-team (at) simplywallst.com.
This article by Simply Wall St is general in nature. We provide commentary based on historical data and analyst forecasts only using an unbiased methodology and our articles are not intended to be financial advice. It does not constitute a recommendation to buy or sell any stock, and does not take account of your objectives, or your financial situation. We aim to bring you long-term focused analysis driven by fundamental data. Note that our analysis may not factor in the latest price-sensitive company announcements or qualitative material. Simply Wall St has no position in any stocks mentioned.
About NSEI:SPRL
SP Refractories
Engages in the manufacturing and supplying of refractory cement and castables in India.
Flawless balance sheet with solid track record.
Similar Companies
Market Insights

Community Narratives

