Does Solar Industries India (NSE:SOLARINDS) Have A Healthy Balance Sheet?


Some say volatility, rather than debt, is the best way to think about risk as an investor, but Warren Buffett famously said that 'Volatility is far from synonymous with risk.' It's only natural to consider a company's balance sheet when you examine how risky it is, since debt is often involved when a business collapses. We can see that Solar Industries India Limited (NSE:SOLARINDS) does use debt in its business. But is this debt a concern to shareholders?
Why Does Debt Bring Risk?
Debt assists a business until the business has trouble paying it off, either with new capital or with free cash flow. Ultimately, if the company can't fulfill its legal obligations to repay debt, shareholders could walk away with nothing. However, a more common (but still painful) scenario is that it has to raise new equity capital at a low price, thus permanently diluting shareholders. Of course, debt can be an important tool in businesses, particularly capital heavy businesses. The first thing to do when considering how much debt a business uses is to look at its cash and debt together.
See our latest analysis for Solar Industries India
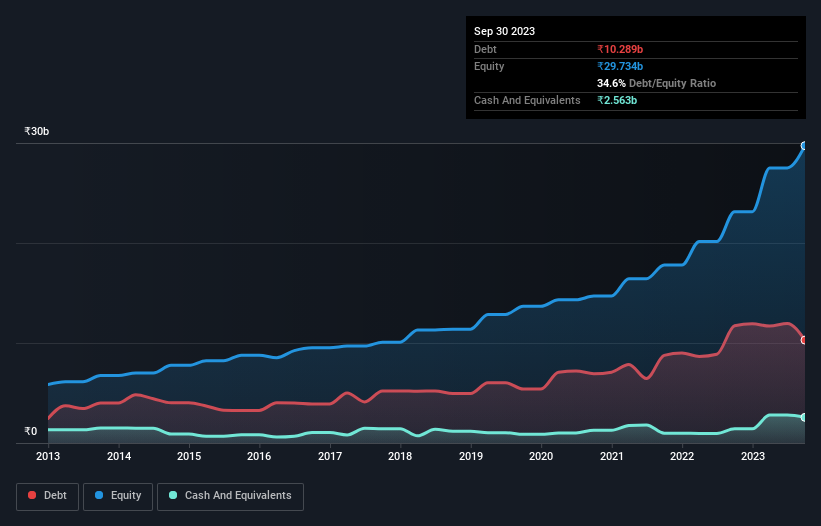
What Is Solar Industries India's Net Debt?
You can click the graphic below for the historical numbers, but it shows that Solar Industries India had ₹10.3b of debt in September 2023, down from ₹11.7b, one year before. On the flip side, it has ₹2.56b in cash leading to net debt of about ₹7.73b.
A Look At Solar Industries India's Liabilities
According to the last reported balance sheet, Solar Industries India had liabilities of ₹14.8b due within 12 months, and liabilities of ₹7.03b due beyond 12 months. On the other hand, it had cash of ₹2.56b and ₹8.72b worth of receivables due within a year. So it has liabilities totalling ₹10.5b more than its cash and near-term receivables, combined.
This state of affairs indicates that Solar Industries India's balance sheet looks quite solid, as its total liabilities are just about equal to its liquid assets. So it's very unlikely that the ₹608.8b company is short on cash, but still worth keeping an eye on the balance sheet. Carrying virtually no net debt, Solar Industries India has a very light debt load indeed.
We use two main ratios to inform us about debt levels relative to earnings. The first is net debt divided by earnings before interest, tax, depreciation, and amortization (EBITDA), while the second is how many times its earnings before interest and tax (EBIT) covers its interest expense (or its interest cover, for short). This way, we consider both the absolute quantum of the debt, as well as the interest rates paid on it.
Solar Industries India has a low net debt to EBITDA ratio of only 0.53. And its EBIT easily covers its interest expense, being 15.2 times the size. So you could argue it is no more threatened by its debt than an elephant is by a mouse. On top of that, Solar Industries India grew its EBIT by 42% over the last twelve months, and that growth will make it easier to handle its debt. There's no doubt that we learn most about debt from the balance sheet. But ultimately the future profitability of the business will decide if Solar Industries India can strengthen its balance sheet over time. So if you want to see what the professionals think, you might find this free report on analyst profit forecasts to be interesting.
Finally, a company can only pay off debt with cold hard cash, not accounting profits. So the logical step is to look at the proportion of that EBIT that is matched by actual free cash flow. Looking at the most recent three years, Solar Industries India recorded free cash flow of 27% of its EBIT, which is weaker than we'd expect. That's not great, when it comes to paying down debt.
Our View
Solar Industries India's interest cover suggests it can handle its debt as easily as Cristiano Ronaldo could score a goal against an under 14's goalkeeper. But, on a more sombre note, we are a little concerned by its conversion of EBIT to free cash flow. Looking at the bigger picture, we think Solar Industries India's use of debt seems quite reasonable and we're not concerned about it. After all, sensible leverage can boost returns on equity. Over time, share prices tend to follow earnings per share, so if you're interested in Solar Industries India, you may well want to click here to check an interactive graph of its earnings per share history.
If you're interested in investing in businesses that can grow profits without the burden of debt, then check out this free list of growing businesses that have net cash on the balance sheet.
New: Manage All Your Stock Portfolios in One Place
We've created the ultimate portfolio companion for stock investors, and it's free.
• Connect an unlimited number of Portfolios and see your total in one currency
• Be alerted to new Warning Signs or Risks via email or mobile
• Track the Fair Value of your stocks
Have feedback on this article? Concerned about the content? Get in touch with us directly. Alternatively, email editorial-team (at) simplywallst.com.
This article by Simply Wall St is general in nature. We provide commentary based on historical data and analyst forecasts only using an unbiased methodology and our articles are not intended to be financial advice. It does not constitute a recommendation to buy or sell any stock, and does not take account of your objectives, or your financial situation. We aim to bring you long-term focused analysis driven by fundamental data. Note that our analysis may not factor in the latest price-sensitive company announcements or qualitative material. Simply Wall St has no position in any stocks mentioned.
About NSEI:SOLARINDS
Solar Industries India
Engages in the manufacture and sale of industrial explosives and explosive initiating devices in India and internationally.
Exceptional growth potential with flawless balance sheet.

