
Advertisement
Should Weakness in Shivalik Rasayan Limited's (NSE:SHIVALIK) Stock Be Seen As A Sign That Market Will Correct The Share Price Given Decent Financials?
With its stock down 19% over the past month, it is easy to disregard Shivalik Rasayan (NSE:SHIVALIK). However, the company's fundamentals look pretty decent, and long-term financials are usually aligned with future market price movements. In this article, we decided to focus on Shivalik Rasayan's ROE.
ROE or return on equity is a useful tool to assess how effectively a company can generate returns on the investment it received from its shareholders. Put another way, it reveals the company's success at turning shareholder investments into profits.
See our latest analysis for Shivalik Rasayan
How To Calculate Return On Equity?
The formula for return on equity is:
Return on Equity = Net Profit (from continuing operations) ÷ Shareholders' Equity
So, based on the above formula, the ROE for Shivalik Rasayan is:
3.6% = ₹181m ÷ ₹5.1b (Based on the trailing twelve months to March 2024).
The 'return' refers to a company's earnings over the last year. Another way to think of that is that for every ₹1 worth of equity, the company was able to earn ₹0.04 in profit.
Why Is ROE Important For Earnings Growth?
So far, we've learned that ROE is a measure of a company's profitability. We now need to evaluate how much profit the company reinvests or "retains" for future growth which then gives us an idea about the growth potential of the company. Assuming everything else remains unchanged, the higher the ROE and profit retention, the higher the growth rate of a company compared to companies that don't necessarily bear these characteristics.
A Side By Side comparison of Shivalik Rasayan's Earnings Growth And 3.6% ROE
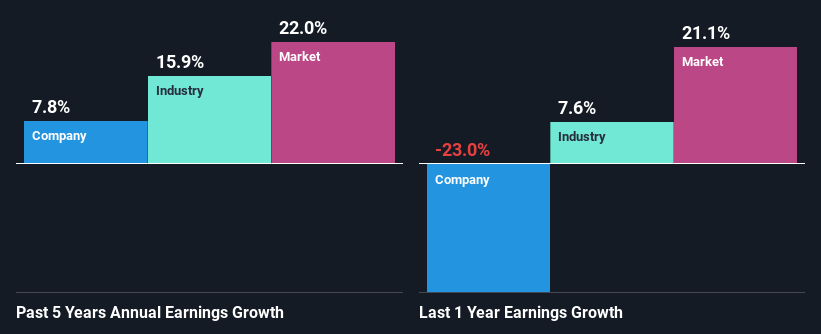
It is quite clear that Shivalik Rasayan's ROE is rather low. Even compared to the average industry ROE of 11%, the company's ROE is quite dismal. Although, we can see that Shivalik Rasayan saw a modest net income growth of 7.8% over the past five years. Therefore, the growth in earnings could probably have been caused by other variables. For example, it is possible that the company's management has made some good strategic decisions, or that the company has a low payout ratio.
As a next step, we compared Shivalik Rasayan's net income growth with the industry and were disappointed to see that the company's growth is lower than the industry average growth of 16% in the same period.
Earnings growth is an important metric to consider when valuing a stock. What investors need to determine next is if the expected earnings growth, or the lack of it, is already built into the share price. Doing so will help them establish if the stock's future looks promising or ominous. Is Shivalik Rasayan fairly valued compared to other companies? These 3 valuation measures might help you decide.
Is Shivalik Rasayan Efficiently Re-investing Its Profits?
In Shivalik Rasayan's case, its respectable earnings growth can probably be explained by its low three-year median payout ratio of 3.4% (or a retention ratio of 97%), which suggests that the company is investing most of its profits to grow its business.
Moreover, Shivalik Rasayan is determined to keep sharing its profits with shareholders which we infer from its long history of seven years of paying a dividend.
Summary
On the whole, we do feel that Shivalik Rasayan has some positive attributes. Namely, its respectable earnings growth, which it achieved due to it retaining most of its profits. However, given the low ROE, investors may not be benefitting from all that reinvestment after all. While we won't completely dismiss the company, what we would do, is try to ascertain how risky the business is to make a more informed decision around the company. To know the 4 risks we have identified for Shivalik Rasayan visit our risks dashboard for free.
New: Manage All Your Stock Portfolios in One Place
We've created the ultimate portfolio companion for stock investors, and it's free.
• Connect an unlimited number of Portfolios and see your total in one currency
• Be alerted to new Warning Signs or Risks via email or mobile
• Track the Fair Value of your stocks
Have feedback on this article? Concerned about the content? Get in touch with us directly. Alternatively, email editorial-team (at) simplywallst.com.
This article by Simply Wall St is general in nature. We provide commentary based on historical data and analyst forecasts only using an unbiased methodology and our articles are not intended to be financial advice. It does not constitute a recommendation to buy or sell any stock, and does not take account of your objectives, or your financial situation. We aim to bring you long-term focused analysis driven by fundamental data. Note that our analysis may not factor in the latest price-sensitive company announcements or qualitative material. Simply Wall St has no position in any stocks mentioned.
About NSEI:SHIVALIK
Shivalik Rasayan
Produces and sells chemicals for the protection of plants in India.
Mediocre balance sheet with very low risk.
Similar Companies
Market Insights

Advertisement
Community Narratives
Kodiak AI - a potential 100 bagger opportunity?
Fair Value US$14.00|44.7% undervalued
DA
Community Contributor
A Fair Price for a Great Business Facing Real Threats
Fair Value US$383.06|13.0% undervalued
IM
Community Contributor
AXON And Shopify Integration Will Unlock Global Mobile Advertising
Fair Value US$646.30|7.3% undervalued
AN
Based on Analyst Price Targets