
Advertisement
Why Investors Shouldn't Be Surprised By Sharda Cropchem Limited's (NSE:SHARDACROP) 29% Share Price Surge
Despite an already strong run, Sharda Cropchem Limited (NSE:SHARDACROP) shares have been powering on, with a gain of 29% in the last thirty days. Not all shareholders will be feeling jubilant, since the share price is still down a very disappointing 13% in the last twelve months.
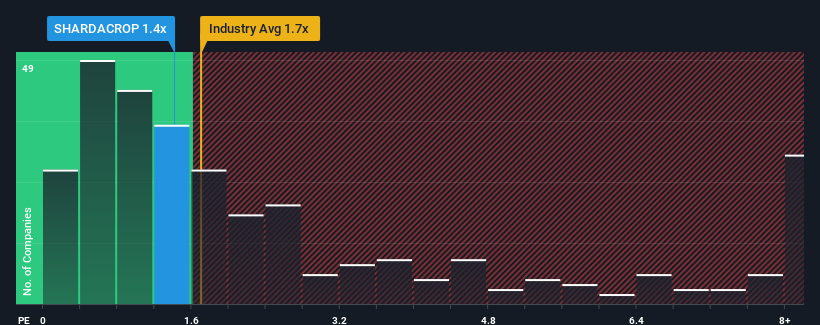
In spite of the firm bounce in price, there still wouldn't be many who think Sharda Cropchem's price-to-sales (or "P/S") ratio of 1.4x is worth a mention when the median P/S in India's Chemicals industry is similar at about 1.7x. Although, it's not wise to simply ignore the P/S without explanation as investors may be disregarding a distinct opportunity or a costly mistake.
View our latest analysis for Sharda Cropchem
What Does Sharda Cropchem's P/S Mean For Shareholders?
Recent times haven't been great for Sharda Cropchem as its revenue has been falling quicker than most other companies. One possibility is that the P/S is moderate because investors think the company's revenue trend will eventually fall in line with most others in the industry. If you still like the company, you'd want its revenue trajectory to turn around before making any decisions. If not, then existing shareholders may be a little nervous about the viability of the share price.
If you'd like to see what analysts are forecasting going forward, you should check out our free report on Sharda Cropchem.What Are Revenue Growth Metrics Telling Us About The P/S?
There's an inherent assumption that a company should be matching the industry for P/S ratios like Sharda Cropchem's to be considered reasonable.
Retrospectively, the last year delivered a frustrating 22% decrease to the company's top line. Even so, admirably revenue has lifted 32% in aggregate from three years ago, notwithstanding the last 12 months. Accordingly, while they would have preferred to keep the run going, shareholders would definitely welcome the medium-term rates of revenue growth.
Turning to the outlook, the next three years should generate growth of 15% each year as estimated by the five analysts watching the company. Meanwhile, the rest of the industry is forecast to expand by 13% per annum, which is not materially different.
With this in mind, it makes sense that Sharda Cropchem's P/S is closely matching its industry peers. It seems most investors are expecting to see average future growth and are only willing to pay a moderate amount for the stock.
What We Can Learn From Sharda Cropchem's P/S?
Sharda Cropchem appears to be back in favour with a solid price jump bringing its P/S back in line with other companies in the industry While the price-to-sales ratio shouldn't be the defining factor in whether you buy a stock or not, it's quite a capable barometer of revenue expectations.
We've seen that Sharda Cropchem maintains an adequate P/S seeing as its revenue growth figures match the rest of the industry. At this stage investors feel the potential for an improvement or deterioration in revenue isn't great enough to push P/S in a higher or lower direction. All things considered, if the P/S and revenue estimates contain no major shocks, then it's hard to see the share price moving strongly in either direction in the near future.
Before you take the next step, you should know about the 2 warning signs for Sharda Cropchem that we have uncovered.
If companies with solid past earnings growth is up your alley, you may wish to see this free collection of other companies with strong earnings growth and low P/E ratios.
New: Manage All Your Stock Portfolios in One Place
We've created the ultimate portfolio companion for stock investors, and it's free.
• Connect an unlimited number of Portfolios and see your total in one currency
• Be alerted to new Warning Signs or Risks via email or mobile
• Track the Fair Value of your stocks
Have feedback on this article? Concerned about the content? Get in touch with us directly. Alternatively, email editorial-team (at) simplywallst.com.
This article by Simply Wall St is general in nature. We provide commentary based on historical data and analyst forecasts only using an unbiased methodology and our articles are not intended to be financial advice. It does not constitute a recommendation to buy or sell any stock, and does not take account of your objectives, or your financial situation. We aim to bring you long-term focused analysis driven by fundamental data. Note that our analysis may not factor in the latest price-sensitive company announcements or qualitative material. Simply Wall St has no position in any stocks mentioned.
Have feedback on this article? Concerned about the content? Get in touch with us directly. Alternatively, email editorial-team@simplywallst.com
About NSEI:SHARDACROP
Sharda Cropchem
A crop protection chemical company, provides various formulations and generic active ingredients worldwide.
Solid track record with excellent balance sheet and pays a dividend.
Similar Companies
Market Insights

Advertisement
Community Narratives
A formidable player in AI and enterprise computing.
Fair Value US$210.00|12.2% overvalued
CO
Community Contributor
IREN's Bold Moves in Sustainable Bitcoin Mining & AI Data Centers
Fair Value US$72.52|17.1% undervalued
BL
Community Contributor
Cooling the Champions: The Aussie Tech Behind F1's Victories
Fair Value AU$12.40|38.1% undervalued
TR
Community Contributor