
Advertisement
- India
- /
- Metals and Mining
- /
- NSEI:SHAHALLOYS
Shah Alloys Limited (NSE:SHAHALLOYS) Soars 26% But It's A Story Of Risk Vs Reward

Despite an already strong run, Shah Alloys Limited (NSE:SHAHALLOYS) shares have been powering on, with a gain of 26% in the last thirty days. Looking back a bit further, it's encouraging to see the stock is up 39% in the last year.
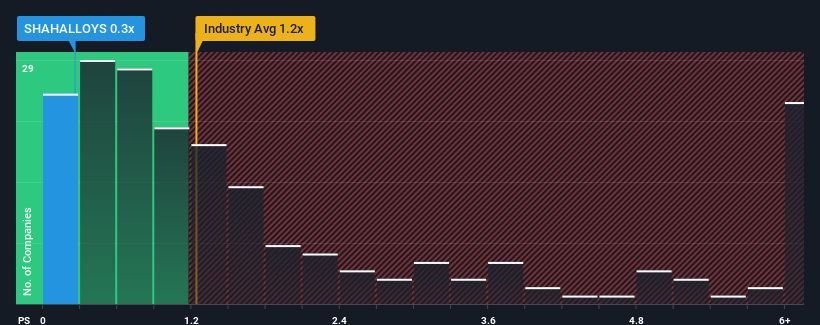
In spite of the firm bounce in price, considering around half the companies operating in India's Metals and Mining industry have price-to-sales ratios (or "P/S") above 1.2x, you may still consider Shah Alloys as an solid investment opportunity with its 0.3x P/S ratio. Although, it's not wise to just take the P/S at face value as there may be an explanation why it's limited.
See our latest analysis for Shah Alloys
How Has Shah Alloys Performed Recently?
As an illustration, revenue has deteriorated at Shah Alloys over the last year, which is not ideal at all. Perhaps the market believes the recent revenue performance isn't good enough to keep up the industry, causing the P/S ratio to suffer. However, if this doesn't eventuate then existing shareholders may be feeling optimistic about the future direction of the share price.
Want the full picture on earnings, revenue and cash flow for the company? Then our free report on Shah Alloys will help you shine a light on its historical performance.How Is Shah Alloys' Revenue Growth Trending?
Shah Alloys' P/S ratio would be typical for a company that's only expected to deliver limited growth, and importantly, perform worse than the industry.
In reviewing the last year of financials, we were disheartened to see the company's revenues fell to the tune of 21%. However, a few very strong years before that means that it was still able to grow revenue by an impressive 69% in total over the last three years. So we can start by confirming that the company has generally done a very good job of growing revenue over that time, even though it had some hiccups along the way.
Comparing that recent medium-term revenue trajectory with the industry's one-year growth forecast of 7.6% shows it's noticeably more attractive.
With this in mind, we find it intriguing that Shah Alloys' P/S isn't as high compared to that of its industry peers. Apparently some shareholders believe the recent performance has exceeded its limits and have been accepting significantly lower selling prices.
The Key Takeaway
Shah Alloys' stock price has surged recently, but its but its P/S still remains modest. Generally, our preference is to limit the use of the price-to-sales ratio to establishing what the market thinks about the overall health of a company.
Our examination of Shah Alloys revealed its three-year revenue trends aren't boosting its P/S anywhere near as much as we would have predicted, given they look better than current industry expectations. When we see strong revenue with faster-than-industry growth, we assume there are some significant underlying risks to the company's ability to make money which is applying downwards pressure on the P/S ratio. At least price risks look to be very low if recent medium-term revenue trends continue, but investors seem to think future revenue could see a lot of volatility.
There are also other vital risk factors to consider and we've discovered 3 warning signs for Shah Alloys (1 can't be ignored!) that you should be aware of before investing here.
Of course, profitable companies with a history of great earnings growth are generally safer bets. So you may wish to see this free collection of other companies that have reasonable P/E ratios and have grown earnings strongly.
New: Manage All Your Stock Portfolios in One Place
We've created the ultimate portfolio companion for stock investors, and it's free.
• Connect an unlimited number of Portfolios and see your total in one currency
• Be alerted to new Warning Signs or Risks via email or mobile
• Track the Fair Value of your stocks
Have feedback on this article? Concerned about the content? Get in touch with us directly. Alternatively, email editorial-team (at) simplywallst.com.
This article by Simply Wall St is general in nature. We provide commentary based on historical data and analyst forecasts only using an unbiased methodology and our articles are not intended to be financial advice. It does not constitute a recommendation to buy or sell any stock, and does not take account of your objectives, or your financial situation. We aim to bring you long-term focused analysis driven by fundamental data. Note that our analysis may not factor in the latest price-sensitive company announcements or qualitative material. Simply Wall St has no position in any stocks mentioned.
About NSEI:SHAHALLOYS
Shah Alloys
Engages in the manufacture and sale of flat and long stainless steel, alloy and special steel, carbon/mild steel, and armor steel products in India and internationally.
Low and slightly overvalued.
Similar Companies
Market Insights


Advertisement
Community Narratives
The Future of Drug Testing? Fingerprint Tech Shows Serious Promise
Fair Value US$2.98|38.6% undervalued
JO
Community Contributor
Suncorp’s Next Chapter: Insurance-Only and Ready to Grow
Fair Value AU$22.83|8.8% undervalued
RO
Community Contributor
Thyssenkrupp Nucera Will Achieve Double-Digit Profits by 2030 Boosted by Hydrogen Growth
Fair Value €14.40|31.6% undervalued
CH
Community Contributor
Tesla’s Nvidia Moment – The AI & Robotics Inflection Point
Fair Value US$384.84|18.0% undervalued
BL
Community Contributor