
Advertisement
Legendary fund manager Li Lu (who Charlie Munger backed) once said, 'The biggest investment risk is not the volatility of prices, but whether you will suffer a permanent loss of capital.' So it might be obvious that you need to consider debt, when you think about how risky any given stock is, because too much debt can sink a company. We can see that Shah Alloys Limited (NSE:SHAHALLOYS) does use debt in its business. But the more important question is: how much risk is that debt creating?
When Is Debt A Problem?
Debt and other liabilities become risky for a business when it cannot easily fulfill those obligations, either with free cash flow or by raising capital at an attractive price. Part and parcel of capitalism is the process of 'creative destruction' where failed businesses are mercilessly liquidated by their bankers. While that is not too common, we often do see indebted companies permanently diluting shareholders because lenders force them to raise capital at a distressed price. Of course, debt can be an important tool in businesses, particularly capital heavy businesses. The first thing to do when considering how much debt a business uses is to look at its cash and debt together.
See our latest analysis for Shah Alloys
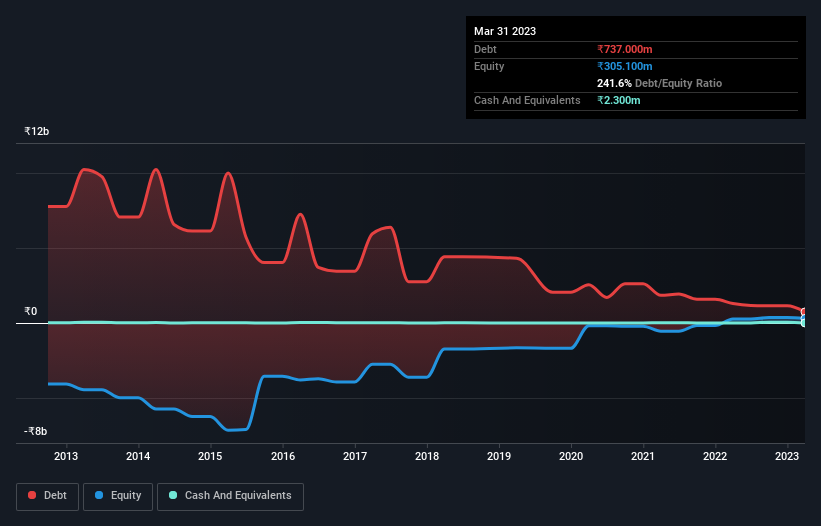
What Is Shah Alloys's Net Debt?
The image below, which you can click on for greater detail, shows that Shah Alloys had debt of ₹737.0m at the end of March 2023, a reduction from ₹1.30b over a year. And it doesn't have much cash, so its net debt is about the same.
How Healthy Is Shah Alloys' Balance Sheet?
The latest balance sheet data shows that Shah Alloys had liabilities of ₹2.49b due within a year, and liabilities of ₹209.7m falling due after that. On the other hand, it had cash of ₹2.30m and ₹151.4m worth of receivables due within a year. So its liabilities outweigh the sum of its cash and (near-term) receivables by ₹2.55b.
The deficiency here weighs heavily on the ₹987.3m company itself, as if a child were struggling under the weight of an enormous back-pack full of books, his sports gear, and a trumpet. So we definitely think shareholders need to watch this one closely. After all, Shah Alloys would likely require a major re-capitalisation if it had to pay its creditors today. When analysing debt levels, the balance sheet is the obvious place to start. But it is Shah Alloys's earnings that will influence how the balance sheet holds up in the future. So if you're keen to discover more about its earnings, it might be worth checking out this graph of its long term earnings trend.
In the last year Shah Alloys had a loss before interest and tax, and actually shrunk its revenue by 29%, to ₹6.3b. To be frank that doesn't bode well.
Caveat Emptor
Not only did Shah Alloys's revenue slip over the last twelve months, but it also produced negative earnings before interest and tax (EBIT). To be specific the EBIT loss came in at ₹32m. If you consider the significant liabilities mentioned above, we are extremely wary of this investment. That said, it is possible that the company will turn its fortunes around. Nevertheless, we would not bet on it given that it lost ₹45m in just last twelve months, and it doesn't have much by way of liquid assets. So while it's not wise to assume the company will fail, we do think it's risky. There's no doubt that we learn most about debt from the balance sheet. But ultimately, every company can contain risks that exist outside of the balance sheet. For example Shah Alloys has 2 warning signs (and 1 which doesn't sit too well with us) we think you should know about.
If, after all that, you're more interested in a fast growing company with a rock-solid balance sheet, then check out our list of net cash growth stocks without delay.
New: Manage All Your Stock Portfolios in One Place
We've created the ultimate portfolio companion for stock investors, and it's free.
• Connect an unlimited number of Portfolios and see your total in one currency
• Be alerted to new Warning Signs or Risks via email or mobile
• Track the Fair Value of your stocks
Have feedback on this article? Concerned about the content? Get in touch with us directly. Alternatively, email editorial-team (at) simplywallst.com.
This article by Simply Wall St is general in nature. We provide commentary based on historical data and analyst forecasts only using an unbiased methodology and our articles are not intended to be financial advice. It does not constitute a recommendation to buy or sell any stock, and does not take account of your objectives, or your financial situation. We aim to bring you long-term focused analysis driven by fundamental data. Note that our analysis may not factor in the latest price-sensitive company announcements or qualitative material. Simply Wall St has no position in any stocks mentioned.
About NSEI:SHAHALLOYS
Shah Alloys
Engages in the manufacture and sale of flat and long stainless steel, alloy and special steel, carbon/mild steel, and armor steel products in India and internationally.
Moderate risk with questionable track record.
Similar Companies
Market Insights

Advertisement
Weekly Picks
RO


RockeTeller on Santacruz Silver Mining ·
Crazy Undervalued 42 Baggers Silver Play (Active & Running Mine)
Fair Value:CA$8696.7% undervalued
50 followersusers have followed this narrative
6 commentsusers have commented on this narrative
16 likesusers have liked this narrative
RO


Robbo on Fiducian Group ·
Fiducian: Compliance Clouds or Value Opportunity?
Fair Value:AU$122.0% undervalued
7 followersusers have followed this narrative
0 commentsusers have commented on this narrative
0 likesusers have liked this narrative
WO

woodworthfund on Willamette Valley Vineyards ·
Willamette Valley Vineyards (WVVI): Not-So-Great Value
Fair Value:US$242.5% overvalued
10 followersusers have followed this narrative
0 commentsusers have commented on this narrative
1 likeusers have liked this narrative
Recently Updated Narratives
IN

IncomeAssets on Pulse Seismic ·
Watch Pulse Seismic Outperform with 13.6% Revenue Growth in the Coming Years
Fair Value:CA$4.4727.3% undervalued
3 followersusers have followed this narrative
0 commentsusers have commented on this narrative
0 likesusers have liked this narrative
VL

Vladislav on Galleon Gold ·
Significantly undervalued gold explorer in Timmins, finally getting traction
Fair Value:CA$481.5% undervalued
6 followersusers have followed this narrative
0 commentsusers have commented on this narrative
0 likesusers have liked this narrative
FU

FundamentallySarcastic on Credit Corp Group ·
Moderation and Stabilisation: HOLD: Fair Price based on a 4-year Cycle is $12.08
Fair Value:AU$12.6410.8% overvalued
6 followersusers have followed this narrative
0 commentsusers have commented on this narrative
0 likesusers have liked this narrative
Popular Narratives
TH


TheWallstreetKing on MicroVision ·
MicroVision will explode future revenue by 380.37% with a vision towards success
Fair Value:US$6098.5% undervalued
116 followersusers have followed this narrative
11 commentsusers have commented on this narrative
22 likesusers have liked this narrative
AN


AnalystConsensusTarget on NVIDIA ·
NVDA: Expanding AI Demand Will Drive Major Data Center Investments Through 2026
Fair Value:US$250.3927.2% undervalued
957 followersusers have followed this narrative
6 commentsusers have commented on this narrative
25 likesusers have liked this narrative
AN

AnalystConsensusTarget on Alphabet ·
GOOGL: AI Platform Expansion And Cloud Demand Will Support Durable Performance Amid Competitive Pressures
Fair Value:US$323.70.8% undervalued
1342 followersusers have followed this narrative
0 commentsusers have commented on this narrative
17 likesusers have liked this narrative

