
Advertisement

Some say volatility, rather than debt, is the best way to think about risk as an investor, but Warren Buffett famously said that 'Volatility is far from synonymous with risk.' It's only natural to consider a company's balance sheet when you examine how risky it is, since debt is often involved when a business collapses. Importantly, Sat Industries Limited (NSE:SATINDLTD) does carry debt. But should shareholders be worried about its use of debt?
When Is Debt Dangerous?
Debt is a tool to help businesses grow, but if a business is incapable of paying off its lenders, then it exists at their mercy. In the worst case scenario, a company can go bankrupt if it cannot pay its creditors. While that is not too common, we often do see indebted companies permanently diluting shareholders because lenders force them to raise capital at a distressed price. Of course, debt can be an important tool in businesses, particularly capital heavy businesses. When we think about a company's use of debt, we first look at cash and debt together.
Check out our latest analysis for Sat Industries
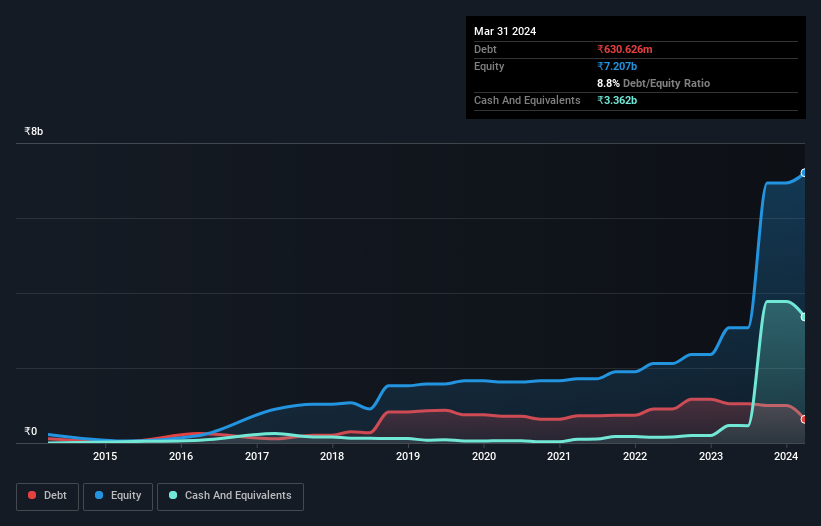
What Is Sat Industries's Net Debt?
The image below, which you can click on for greater detail, shows that Sat Industries had debt of ₹630.6m at the end of March 2024, a reduction from ₹1.05b over a year. However, its balance sheet shows it holds ₹3.36b in cash, so it actually has ₹2.73b net cash.
How Strong Is Sat Industries' Balance Sheet?
According to the last reported balance sheet, Sat Industries had liabilities of ₹1.53b due within 12 months, and liabilities of ₹198.3m due beyond 12 months. Offsetting these obligations, it had cash of ₹3.36b as well as receivables valued at ₹2.40b due within 12 months. So it can boast ₹4.04b more liquid assets than total liabilities.
This luscious liquidity implies that Sat Industries' balance sheet is sturdy like a giant sequoia tree. On this view, lenders should feel as safe as the beloved of a black-belt karate master. Succinctly put, Sat Industries boasts net cash, so it's fair to say it does not have a heavy debt load!
Better yet, Sat Industries grew its EBIT by 537% last year, which is an impressive improvement. That boost will make it even easier to pay down debt going forward. The balance sheet is clearly the area to focus on when you are analysing debt. But it is Sat Industries's earnings that will influence how the balance sheet holds up in the future. So when considering debt, it's definitely worth looking at the earnings trend. Click here for an interactive snapshot.
Finally, a company can only pay off debt with cold hard cash, not accounting profits. While Sat Industries has net cash on its balance sheet, it's still worth taking a look at its ability to convert earnings before interest and tax (EBIT) to free cash flow, to help us understand how quickly it is building (or eroding) that cash balance. During the last three years, Sat Industries burned a lot of cash. While investors are no doubt expecting a reversal of that situation in due course, it clearly does mean its use of debt is more risky.
Summing Up
While we empathize with investors who find debt concerning, you should keep in mind that Sat Industries has net cash of ₹2.73b, as well as more liquid assets than liabilities. And we liked the look of last year's 537% year-on-year EBIT growth. So we don't think Sat Industries's use of debt is risky. The balance sheet is clearly the area to focus on when you are analysing debt. However, not all investment risk resides within the balance sheet - far from it. For example Sat Industries has 2 warning signs (and 1 which is a bit unpleasant) we think you should know about.
At the end of the day, it's often better to focus on companies that are free from net debt. You can access our special list of such companies (all with a track record of profit growth). It's free.
New: Manage All Your Stock Portfolios in One Place
We've created the ultimate portfolio companion for stock investors, and it's free.
• Connect an unlimited number of Portfolios and see your total in one currency
• Be alerted to new Warning Signs or Risks via email or mobile
• Track the Fair Value of your stocks
Have feedback on this article? Concerned about the content? Get in touch with us directly. Alternatively, email editorial-team (at) simplywallst.com.
This article by Simply Wall St is general in nature. We provide commentary based on historical data and analyst forecasts only using an unbiased methodology and our articles are not intended to be financial advice. It does not constitute a recommendation to buy or sell any stock, and does not take account of your objectives, or your financial situation. We aim to bring you long-term focused analysis driven by fundamental data. Note that our analysis may not factor in the latest price-sensitive company announcements or qualitative material. Simply Wall St has no position in any stocks mentioned.
Have feedback on this article? Concerned about the content? Get in touch with us directly. Alternatively, email editorial-team@simplywallst.com
About NSEI:SATINDLTD
Aeroflex Enterprises
Manufactures and sells stainless-steel flexible hoses and assemblies in India and internationally.
Flawless balance sheet and fair value.
Market Insights

Advertisement
Community Narratives
WhiteCap Is Positioned To Profit Regardless Of Trump's Policy 
Fair Value CA$22.60|61.6% undervalued
ST
Equity Analyst and Writer
Microsoft's Evolution Will Drive Revenue to New Heights Fueled by AI
Fair Value US$360.00|28.3% overvalued
BR
Community Contributor
A CASE FOR USD$2.50 (CAD$3.44) BY 2028 (A 5-10 BAGGER)
Fair Value CA$3.44|87.8% undervalued
AG
Community Contributor