Has Sah Polymers Limited's (NSE:SAH) Impressive Stock Performance Got Anything to Do With Its Fundamentals?


Sah Polymers' (NSE:SAH) stock is up by a considerable 12% over the past week. We wonder if and what role the company's financials play in that price change as a company's long-term fundamentals usually dictate market outcomes. In this article, we decided to focus on Sah Polymers' ROE.
Return on equity or ROE is a key measure used to assess how efficiently a company's management is utilizing the company's capital. In other words, it is a profitability ratio which measures the rate of return on the capital provided by the company's shareholders.
Check out our latest analysis for Sah Polymers
How To Calculate Return On Equity?
ROE can be calculated by using the formula:
Return on Equity = Net Profit (from continuing operations) ÷ Shareholders' Equity
So, based on the above formula, the ROE for Sah Polymers is:
2.5% = ₹21m ÷ ₹869m (Based on the trailing twelve months to September 2023).
The 'return' is the yearly profit. Another way to think of that is that for every ₹1 worth of equity, the company was able to earn ₹0.02 in profit.
Why Is ROE Important For Earnings Growth?
So far, we've learned that ROE is a measure of a company's profitability. Depending on how much of these profits the company reinvests or "retains", and how effectively it does so, we are then able to assess a company’s earnings growth potential. Assuming everything else remains unchanged, the higher the ROE and profit retention, the higher the growth rate of a company compared to companies that don't necessarily bear these characteristics.
Sah Polymers' Earnings Growth And 2.5% ROE
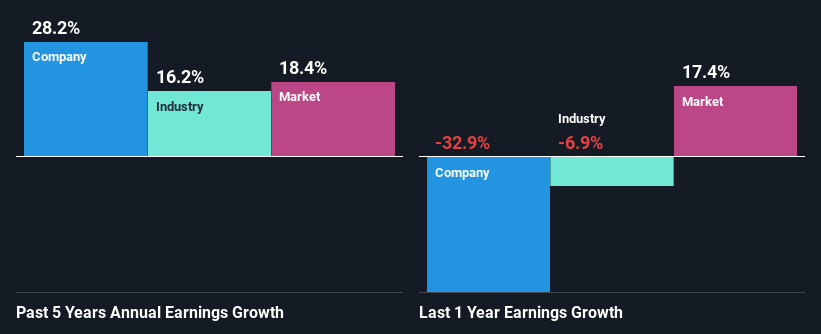
It is quite clear that Sah Polymers' ROE is rather low. Even compared to the average industry ROE of 10%, the company's ROE is quite dismal. Despite this, surprisingly, Sah Polymers saw an exceptional 28% net income growth over the past five years. We believe that there might be other aspects that are positively influencing the company's earnings growth. For example, it is possible that the company's management has made some good strategic decisions, or that the company has a low payout ratio.
Next, on comparing with the industry net income growth, we found that Sah Polymers' growth is quite high when compared to the industry average growth of 16% in the same period, which is great to see.
The basis for attaching value to a company is, to a great extent, tied to its earnings growth. It’s important for an investor to know whether the market has priced in the company's expected earnings growth (or decline). This then helps them determine if the stock is placed for a bright or bleak future. If you're wondering about Sah Polymers''s valuation, check out this gauge of its price-to-earnings ratio, as compared to its industry.
Is Sah Polymers Efficiently Re-investing Its Profits?
The three-year median payout ratio for Sah Polymers is 30%, which is moderately low. The company is retaining the remaining 70%. By the looks of it, the dividend is well covered and Sah Polymers is reinvesting its profits efficiently as evidenced by its exceptional growth which we discussed above.
Summary
On the whole, we do feel that Sah Polymers has some positive attributes. Despite its low rate of return, the fact that the company reinvests a very high portion of its profits into its business, no doubt contributed to its high earnings growth. While we won't completely dismiss the company, what we would do, is try to ascertain how risky the business is to make a more informed decision around the company. To know the 4 risks we have identified for Sah Polymers visit our risks dashboard for free.
New: Manage All Your Stock Portfolios in One Place
We've created the ultimate portfolio companion for stock investors, and it's free.
• Connect an unlimited number of Portfolios and see your total in one currency
• Be alerted to new Warning Signs or Risks via email or mobile
• Track the Fair Value of your stocks
Have feedback on this article? Concerned about the content? Get in touch with us directly. Alternatively, email editorial-team (at) simplywallst.com.
This article by Simply Wall St is general in nature. We provide commentary based on historical data and analyst forecasts only using an unbiased methodology and our articles are not intended to be financial advice. It does not constitute a recommendation to buy or sell any stock, and does not take account of your objectives, or your financial situation. We aim to bring you long-term focused analysis driven by fundamental data. Note that our analysis may not factor in the latest price-sensitive company announcements or qualitative material. Simply Wall St has no position in any stocks mentioned.
About NSEI:SAH
Sah Polymers
Manufactures and sells packaging solutions in India and internationally.
Adequate balance sheet slight.
Similar Companies
Market Insights

Community Narratives

