
Advertisement
- India
- /
- Metals and Mining
- /
- NSEI:RAMASTEEL
What Do The Returns On Capital At Rama Steel Tubes (NSE:RAMASTEEL) Tell Us?

What are the early trends we should look for to identify a stock that could multiply in value over the long term? One common approach is to try and find a company with returns on capital employed (ROCE) that are increasing, in conjunction with a growing amount of capital employed. Put simply, these types of businesses are compounding machines, meaning they are continually reinvesting their earnings at ever-higher rates of return. Although, when we looked at Rama Steel Tubes (NSE:RAMASTEEL), it didn't seem to tick all of these boxes.
What is Return On Capital Employed (ROCE)?
For those who don't know, ROCE is a measure of a company's yearly pre-tax profit (its return), relative to the capital employed in the business. To calculate this metric for Rama Steel Tubes, this is the formula:
Return on Capital Employed = Earnings Before Interest and Tax (EBIT) ÷ (Total Assets - Current Liabilities)
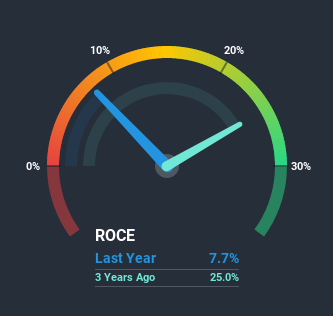
0.077 = ₹87m ÷ (₹2.2b - ₹1.0b) (Based on the trailing twelve months to September 2020).
Therefore, Rama Steel Tubes has an ROCE of 7.7%. In absolute terms, that's a low return but it's around the Metals and Mining industry average of 9.4%.
See our latest analysis for Rama Steel Tubes
While the past is not representative of the future, it can be helpful to know how a company has performed historically, which is why we have this chart above. If you want to delve into the historical earnings, revenue and cash flow of Rama Steel Tubes, check out these free graphs here.
The Trend Of ROCE
In terms of Rama Steel Tubes' historical ROCE movements, the trend isn't fantastic. Over the last five years, returns on capital have decreased to 7.7% from 18% five years ago. And considering revenue has dropped while employing more capital, we'd be cautious. This could mean that the business is losing its competitive advantage or market share, because while more money is being put into ventures, it's actually producing a lower return - "less bang for their buck" per se.
On a related note, Rama Steel Tubes has decreased its current liabilities to 48% of total assets. That could partly explain why the ROCE has dropped. Effectively this means their suppliers or short-term creditors are funding less of the business, which reduces some elements of risk. Since the business is basically funding more of its operations with it's own money, you could argue this has made the business less efficient at generating ROCE. Keep in mind 48% is still pretty high, so those risks are still somewhat prevalent.
The Bottom Line On Rama Steel Tubes' ROCE
In summary, we're somewhat concerned by Rama Steel Tubes' diminishing returns on increasing amounts of capital. Long term shareholders who've owned the stock over the last five years have experienced a 20% depreciation in their investment, so it appears the market might not like these trends either. Unless there is a shift to a more positive trajectory in these metrics, we would look elsewhere.
On a final note, we found 4 warning signs for Rama Steel Tubes (2 are concerning) you should be aware of.
For those who like to invest in solid companies, check out this free list of companies with solid balance sheets and high returns on equity.
When trading Rama Steel Tubes or any other investment, use the platform considered by many to be the Professional's Gateway to the Worlds Market, Interactive Brokers. You get the lowest-cost* trading on stocks, options, futures, forex, bonds and funds worldwide from a single integrated account. Promoted
New: AI Stock Screener & Alerts
Our new AI Stock Screener scans the market every day to uncover opportunities.
• Dividend Powerhouses (3%+ Yield)
• Undervalued Small Caps with Insider Buying
• High growth Tech and AI Companies
Or build your own from over 50 metrics.
This article by Simply Wall St is general in nature. It does not constitute a recommendation to buy or sell any stock, and does not take account of your objectives, or your financial situation. We aim to bring you long-term focused analysis driven by fundamental data. Note that our analysis may not factor in the latest price-sensitive company announcements or qualitative material. Simply Wall St has no position in any stocks mentioned.
*Interactive Brokers Rated Lowest Cost Broker by StockBrokers.com Annual Online Review 2020
Have feedback on this article? Concerned about the content? Get in touch with us directly. Alternatively, email editorial-team (at) simplywallst.com.
About NSEI:RAMASTEEL
Rama Steel Tubes
Engages in the manufacture and trading of steel pipes and tubes, and rigid poly vinyl chloride and galvanized iron pipes in India and internationally.
Excellent balance sheet and slightly overvalued.
Similar Companies
Market Insights


Advertisement
Community Narratives
A case for TSXV:USA to reach USD $5.00 - $9.00 (CAD $7.30–$12.29) by 2029.
Fair Value CA$12.29|91.2% undervalued
AG
Community Contributor
DLocal's Future Growth Fueled by 35% Revenue and Profit Margin Boosts
Fair Value US$195.39|94.1% undervalued
WY
Community Contributor
Historically Cheap, but the Margin of Safety Is Still Thin
Fair Value SEK 232.58|13.2% undervalued
MA
Community Contributor