Advertisement
Some say volatility, rather than debt, is the best way to think about risk as an investor, but Warren Buffett famously said that 'Volatility is far from synonymous with risk.' When we think about how risky a company is, we always like to look at its use of debt, since debt overload can lead to ruin. As with many other companies Polyplex Corporation Limited (NSE:POLYPLEX) makes use of debt. But the more important question is: how much risk is that debt creating?
When Is Debt Dangerous?
Debt is a tool to help businesses grow, but if a business is incapable of paying off its lenders, then it exists at their mercy. Ultimately, if the company can't fulfill its legal obligations to repay debt, shareholders could walk away with nothing. However, a more usual (but still expensive) situation is where a company must dilute shareholders at a cheap share price simply to get debt under control. By replacing dilution, though, debt can be an extremely good tool for businesses that need capital to invest in growth at high rates of return. When we think about a company's use of debt, we first look at cash and debt together.
View our latest analysis for Polyplex
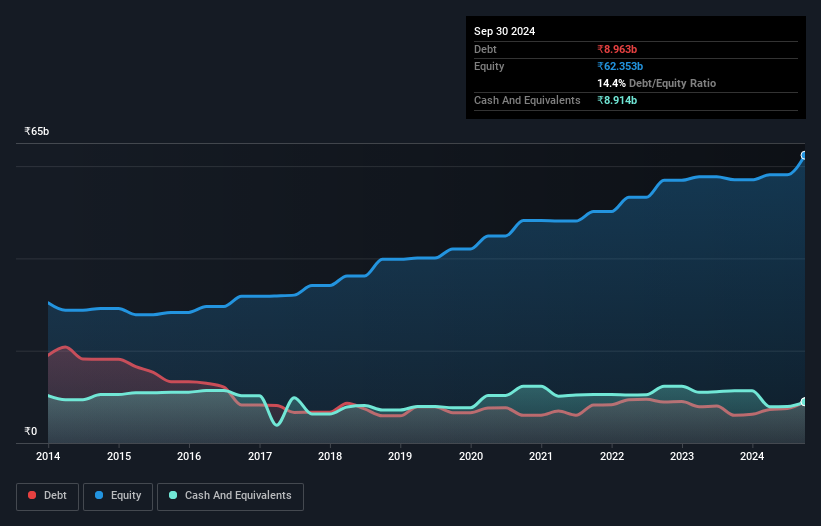
What Is Polyplex's Debt?
As you can see below, at the end of September 2024, Polyplex had ₹8.96b of debt, up from ₹5.99b a year ago. Click the image for more detail. However, it also had ₹8.91b in cash, and so its net debt is ₹48.8m.
A Look At Polyplex's Liabilities
According to the last reported balance sheet, Polyplex had liabilities of ₹13.0b due within 12 months, and liabilities of ₹4.90b due beyond 12 months. Offsetting these obligations, it had cash of ₹8.91b as well as receivables valued at ₹10.5b due within 12 months. So it can boast ₹1.47b more liquid assets than total liabilities.
This surplus suggests that Polyplex has a conservative balance sheet, and could probably eliminate its debt without much difficulty. But either way, Polyplex has virtually no net debt, so it's fair to say it does not have a heavy debt load!
In order to size up a company's debt relative to its earnings, we calculate its net debt divided by its earnings before interest, tax, depreciation, and amortization (EBITDA) and its earnings before interest and tax (EBIT) divided by its interest expense (its interest cover). Thus we consider debt relative to earnings both with and without depreciation and amortization expenses.
With debt at a measly 0.008 times EBITDA and EBIT covering interest a whopping 164 times, it's clear that Polyplex is not a desperate borrower. So relative to past earnings, the debt load seems trivial. Also good is that Polyplex grew its EBIT at 15% over the last year, further increasing its ability to manage debt. The balance sheet is clearly the area to focus on when you are analysing debt. But it is Polyplex's earnings that will influence how the balance sheet holds up in the future. So if you're keen to discover more about its earnings, it might be worth checking out this graph of its long term earnings trend.
Finally, while the tax-man may adore accounting profits, lenders only accept cold hard cash. So we always check how much of that EBIT is translated into free cash flow. In the last three years, Polyplex's free cash flow amounted to 34% of its EBIT, less than we'd expect. That weak cash conversion makes it more difficult to handle indebtedness.
Our View
Happily, Polyplex's impressive interest cover implies it has the upper hand on its debt. But truth be told we feel its conversion of EBIT to free cash flow does undermine this impression a bit. Looking at the bigger picture, we think Polyplex's use of debt seems quite reasonable and we're not concerned about it. While debt does bring risk, when used wisely it can also bring a higher return on equity. When analysing debt levels, the balance sheet is the obvious place to start. But ultimately, every company can contain risks that exist outside of the balance sheet. To that end, you should learn about the 2 warning signs we've spotted with Polyplex (including 1 which is a bit unpleasant) .
At the end of the day, it's often better to focus on companies that are free from net debt. You can access our special list of such companies (all with a track record of profit growth). It's free.
New: Manage All Your Stock Portfolios in One Place
We've created the ultimate portfolio companion for stock investors, and it's free.
• Connect an unlimited number of Portfolios and see your total in one currency
• Be alerted to new Warning Signs or Risks via email or mobile
• Track the Fair Value of your stocks
Have feedback on this article? Concerned about the content? Get in touch with us directly. Alternatively, email editorial-team (at) simplywallst.com.
This article by Simply Wall St is general in nature. We provide commentary based on historical data and analyst forecasts only using an unbiased methodology and our articles are not intended to be financial advice. It does not constitute a recommendation to buy or sell any stock, and does not take account of your objectives, or your financial situation. We aim to bring you long-term focused analysis driven by fundamental data. Note that our analysis may not factor in the latest price-sensitive company announcements or qualitative material. Simply Wall St has no position in any stocks mentioned.
About NSEI:POLYPLEX
Polyplex
Engages in the manufacture and sale of polymeric films in India, other Asian countries, Europe, the Americas, and internationally.
Excellent balance sheet second-rate dividend payer.
Similar Companies
Market Insights


Advertisement
Weekly Picks
LO


Lou_Basenese on Giftify ·
Giftify ($GIFT): A Small-Cap Incentives Platform with More ScaleThan Its Valuation Suggests
Fair Value:US$2.564.5% undervalued
61 followersusers have followed this narrative
2 commentsusers have commented on this narrative
11 likesusers have liked this narrative
HA


HarishPK on lululemon athletica ·
Quantifying the Transition: Why Lululemon’s Moat Remains Intact
Fair Value:US$161.825.6% undervalued
23 followersusers have followed this narrative
2 commentsusers have commented on this narrative
9 likesusers have liked this narrative
TR


tripledub on Alphabet ·
Warren Buffett Just Bet $10 Billion on Google. The Catch? You May Already Be Too Late.
Fair Value:US$23053.3% overvalued
65 followersusers have followed this narrative
1 commentusers have commented on this narrative
17 likesusers have liked this narrative
JO


John_Eric on Veeva Systems ·
AI-Powered Veeva Systems Poised for Solid Growth Amid Regulatory Stability
Fair Value:US$32038.5% undervalued
32 followersusers have followed this narrative
0 commentsusers have commented on this narrative
6 likesusers have liked this narrative
Recently Updated Narratives
BR

browser on Bentley Systems ·
Bentley Systems’ Strategic Positioning in the Digital Infrastructure Cycle
Fair Value:US$15.72102.0% overvalued
1 followerusers have followed this narrative
0 commentsusers have commented on this narrative
0 likesusers have liked this narrative
BE

benjamin_lvieq on PayPal Holdings ·
PayPal: PayPal Doesn't Need to Grow – It Needs to Stop Falling – A Mispriced Cash Machine With a Cannibal Buyback
Fair Value:US$6526.7% undervalued
14 followersusers have followed this narrative
0 commentsusers have commented on this narrative
0 likesusers have liked this narrative
AR

ariz_scribe on Marti Technologies ·
$MRT at Roth - Pick of the Panel
Fair Value:US$1.9628.6% undervalued
5 followersusers have followed this narrative
0 commentsusers have commented on this narrative
0 likesusers have liked this narrative
Popular Narratives
IN


Investingwilly on Mastercard ·
Mastercard: The Best Dividend Stock You're Ignoring
Fair Value:US$75028.3% undervalued
89 followersusers have followed this narrative
1 commentusers have commented on this narrative
9 likesusers have liked this narrative
BL


BlackGoat on Cerebras Systems ·
The Wafer Giant Threatening NVIDIA's GPU Hegemony
Fair Value:US$415.5450.8% undervalued
61 followersusers have followed this narrative
3 commentsusers have commented on this narrative
11 likesusers have liked this narrative
TR
tripledub on Alphabet ·
Warren Buffett Just Bet $10 Billion on Google. The Catch? You May Already Be Too Late.
Fair Value:US$23053.3% overvalued
65 followersusers have followed this narrative
1 commentusers have commented on this narrative
17 likesusers have liked this narrative
