
Advertisement
- India
- /
- Metals and Mining
- /
- NSEI:KIRLOSIND
Why Kirloskar Industries Limited’s (NSE:KIRLOSIND) Use Of Investor Capital Doesn’t Look Great

Today we'll evaluate Kirloskar Industries Limited (NSE:KIRLOSIND) to determine whether it could have potential as an investment idea. Specifically, we're going to calculate its Return On Capital Employed (ROCE), in the hopes of getting some insight into the business.
First of all, we'll work out how to calculate ROCE. Next, we'll compare it to others in its industry. Last but not least, we'll look at what impact its current liabilities have on its ROCE.
What is Return On Capital Employed (ROCE)?
ROCE is a metric for evaluating how much pre-tax income (in percentage terms) a company earns on the capital invested in its business. Generally speaking a higher ROCE is better. Ultimately, it is a useful but imperfect metric. Renowned investment researcher Michael Mauboussin has suggested that a high ROCE can indicate that 'one dollar invested in the company generates value of more than one dollar'.
How Do You Calculate Return On Capital Employed?
Analysts use this formula to calculate return on capital employed:
Return on Capital Employed = Earnings Before Interest and Tax (EBIT) ÷ (Total Assets - Current Liabilities)
Or for Kirloskar Industries:
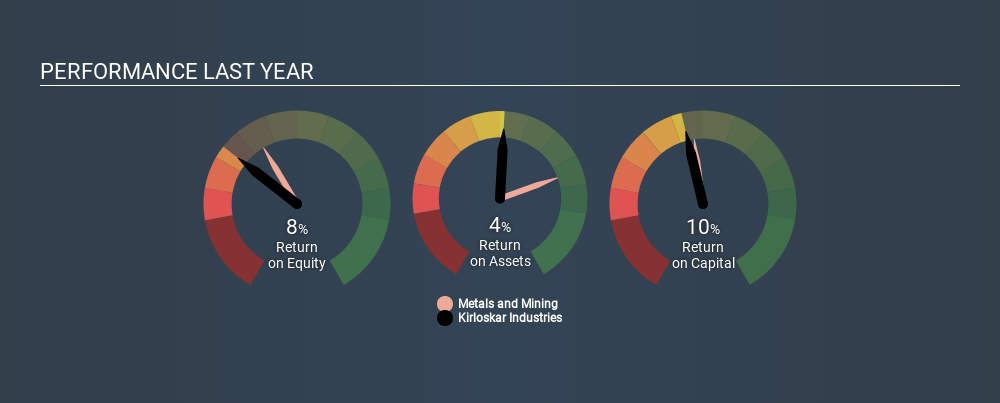
0.10 = ₹1.9b ÷ (₹24b - ₹5.5b) (Based on the trailing twelve months to September 2019.)
Therefore, Kirloskar Industries has an ROCE of 10%.
Check out our latest analysis for Kirloskar Industries
Is Kirloskar Industries's ROCE Good?
One way to assess ROCE is to compare similar companies. In this analysis, Kirloskar Industries's ROCE appears meaningfully below the 14% average reported by the Metals and Mining industry. This could be seen as a negative, as it suggests some competitors may be employing their capital more efficiently. Aside from the industry comparison, Kirloskar Industries's ROCE is mediocre in absolute terms, considering the risk of investing in stocks versus the safety of a bank account. Readers may find more attractive investment prospects elsewhere.
The image below shows how Kirloskar Industries's ROCE compares to its industry, and you can click it to see more detail on its past growth.
When considering this metric, keep in mind that it is backwards looking, and not necessarily predictive. ROCE can be misleading for companies in cyclical industries, with returns looking impressive during the boom times, but very weak during the busts. This is because ROCE only looks at one year, instead of considering returns across a whole cycle. Given the industry it operates in, Kirloskar Industries could be considered cyclical. If Kirloskar Industries is cyclical, it could make sense to check out this free graph of past earnings, revenue and cash flow.
What Are Current Liabilities, And How Do They Affect Kirloskar Industries's ROCE?
Liabilities, such as supplier bills and bank overdrafts, are referred to as current liabilities if they need to be paid within 12 months. The ROCE equation subtracts current liabilities from capital employed, so a company with a lot of current liabilities appears to have less capital employed, and a higher ROCE than otherwise. To counter this, investors can check if a company has high current liabilities relative to total assets.
Kirloskar Industries has total assets of ₹24b and current liabilities of ₹5.5b. Therefore its current liabilities are equivalent to approximately 23% of its total assets. This is a modest level of current liabilities, which would only have a small effect on ROCE.
The Bottom Line On Kirloskar Industries's ROCE
That said, Kirloskar Industries's ROCE is mediocre, there may be more attractive investments around. But note: make sure you look for a great company, not just the first idea you come across. So take a peek at this free list of interesting companies with strong recent earnings growth (and a P/E ratio below 20).
If you are like me, then you will not want to miss this free list of growing companies that insiders are buying.
If you spot an error that warrants correction, please contact the editor at editorial-team@simplywallst.com. This article by Simply Wall St is general in nature. It does not constitute a recommendation to buy or sell any stock, and does not take account of your objectives, or your financial situation. Simply Wall St has no position in the stocks mentioned.
We aim to bring you long-term focused research analysis driven by fundamental data. Note that our analysis may not factor in the latest price-sensitive company announcements or qualitative material. Thank you for reading.
About NSEI:KIRLOSIND
Excellent balance sheet average dividend payer.
Market Insights


Advertisement
Community Narratives
For the Emperor: Why Games Workshop Could Be a Star Investment
Fair Value UK£160.00|0.4% overvalued
RO
Community Contributor
Securitas will boost margins with AI and tech-driven services
Fair Value SEK 260.91|44.5% undervalued
UN
Community Contributor
A Leader in EV Charging with Growth Potential
Fair Value €27.00|17.8% undervalued
TI
Community Contributor