- India
- /
- Basic Materials
- /
- NSEI:KAKATCEM
These Metrics Don't Make Kakatiya Cement Sugar and Industries (NSE:KAKATCEM) Look Too Strong

What financial metrics can indicate to us that a company is maturing or even in decline? Typically, we'll see the trend of both return on capital employed (ROCE) declining and this usually coincides with a decreasing amount of capital employed. This indicates to us that the business is not only shrinking the size of its net assets, but its returns are falling as well. And from a first read, things don't look too good at Kakatiya Cement Sugar and Industries (NSE:KAKATCEM), so let's see why.
What is Return On Capital Employed (ROCE)?
For those who don't know, ROCE is a measure of a company's yearly pre-tax profit (its return), relative to the capital employed in the business. Analysts use this formula to calculate it for Kakatiya Cement Sugar and Industries:
Return on Capital Employed = Earnings Before Interest and Tax (EBIT) ÷ (Total Assets - Current Liabilities)
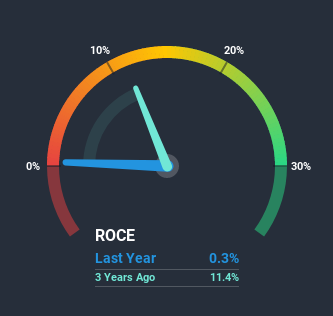
0.0034 = ₹7.9m ÷ (₹3.0b - ₹713m) (Based on the trailing twelve months to December 2020).
So, Kakatiya Cement Sugar and Industries has an ROCE of 0.3%. Ultimately, that's a low return and it under-performs the Basic Materials industry average of 13%.
View our latest analysis for Kakatiya Cement Sugar and Industries
While the past is not representative of the future, it can be helpful to know how a company has performed historically, which is why we have this chart above. If you want to delve into the historical earnings, revenue and cash flow of Kakatiya Cement Sugar and Industries, check out these free graphs here.
What The Trend Of ROCE Can Tell Us
There is reason to be cautious about Kakatiya Cement Sugar and Industries, given the returns are trending downwards. Unfortunately the returns on capital have diminished from the 11% that they were earning five years ago. And on the capital employed front, the business is utilizing roughly the same amount of capital as it was back then. This combination can be indicative of a mature business that still has areas to deploy capital, but the returns received aren't as high due potentially to new competition or smaller margins. If these trends continue, we wouldn't expect Kakatiya Cement Sugar and Industries to turn into a multi-bagger.
On a side note, Kakatiya Cement Sugar and Industries' current liabilities have increased over the last five years to 23% of total assets, effectively distorting the ROCE to some degree. Without this increase, it's likely that ROCE would be even lower than 0.3%. Keep an eye on this ratio, because the business could encounter some new risks if this metric gets too high.
The Bottom Line On Kakatiya Cement Sugar and Industries' ROCE
In summary, it's unfortunate that Kakatiya Cement Sugar and Industries is generating lower returns from the same amount of capital. And, the stock has remained flat over the last five years, so investors don't seem too impressed either. That being the case, unless the underlying trends revert to a more positive trajectory, we'd consider looking elsewhere.
If you'd like to know more about Kakatiya Cement Sugar and Industries, we've spotted 3 warning signs, and 1 of them can't be ignored.
While Kakatiya Cement Sugar and Industries may not currently earn the highest returns, we've compiled a list of companies that currently earn more than 25% return on equity. Check out this free list here.
When trading Kakatiya Cement Sugar and Industries or any other investment, use the platform considered by many to be the Professional's Gateway to the Worlds Market, Interactive Brokers. You get the lowest-cost* trading on stocks, options, futures, forex, bonds and funds worldwide from a single integrated account. Promoted
The New Payments ETF Is Live on NASDAQ:
Money is moving to real-time rails, and a newly listed ETF now gives investors direct exposure. Fast settlement. Institutional custody. Simple access.
Explore how this launch could reshape portfolios
Sponsored ContentValuation is complex, but we're here to simplify it.
Discover if Kakatiya Cement Sugar and Industries might be undervalued or overvalued with our detailed analysis, featuring fair value estimates, potential risks, dividends, insider trades, and its financial condition.
Access Free AnalysisThis article by Simply Wall St is general in nature. It does not constitute a recommendation to buy or sell any stock, and does not take account of your objectives, or your financial situation. We aim to bring you long-term focused analysis driven by fundamental data. Note that our analysis may not factor in the latest price-sensitive company announcements or qualitative material. Simply Wall St has no position in any stocks mentioned.
*Interactive Brokers Rated Lowest Cost Broker by StockBrokers.com Annual Online Review 2020
Have feedback on this article? Concerned about the content? Get in touch with us directly. Alternatively, email editorial-team (at) simplywallst.com.
About NSEI:KAKATCEM
Kakatiya Cement Sugar and Industries
Produces, manufactures, refines, and sells Portland cement in India.
Excellent balance sheet average dividend payer.
Similar Companies
Market Insights

Weekly Picks

Early mover in a fast growing industry. Likely to experience share price volatility as they scale


A case for CA$31.80 (undiluted), aka 8,616% upside from CA$0.37 (an 86 bagger!).


Moderation and Stabilisation: HOLD: Fair Price based on a 4-year Cycle is $12.08
Recently Updated Narratives


An amazing opportunity to potentially get a 100 bagger

Amazon: Why the World’s Biggest Platform Still Runs on Invisible Economics

Sunrun Stock: When the Energy Transition Collides With the Cost of Capital
Popular Narratives


MicroVision will explode future revenue by 380.37% with a vision towards success


Crazy Undervalued 42 Baggers Silver Play (Active & Running Mine)

