- India
- /
- Metals and Mining
- /
- NSEI:JSL
What Can The Trends At Jindal Stainless (NSE:JSL) Tell Us About Their Returns?


If we want to find a potential multi-bagger, often there are underlying trends that can provide clues. In a perfect world, we'd like to see a company investing more capital into its business and ideally the returns earned from that capital are also increasing. This shows us that it's a compounding machine, able to continually reinvest its earnings back into the business and generate higher returns. With that in mind, we've noticed some promising trends at Jindal Stainless (NSE:JSL) so let's look a bit deeper.
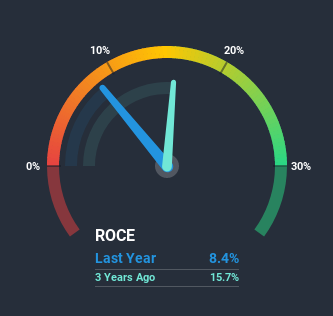
Understanding Return On Capital Employed (ROCE)
If you haven't worked with ROCE before, it measures the 'return' (pre-tax profit) a company generates from capital employed in its business. Analysts use this formula to calculate it for Jindal Stainless:
Return on Capital Employed = Earnings Before Interest and Tax (EBIT) ÷ (Total Assets - Current Liabilities)
0.084 = ₹5.1b ÷ (₹102b - ₹42b) (Based on the trailing twelve months to September 2020).
So, Jindal Stainless has an ROCE of 8.4%. In absolute terms, that's a low return but it's around the Metals and Mining industry average of 9.5%.
See our latest analysis for Jindal Stainless
In the above chart we have measured Jindal Stainless' prior ROCE against its prior performance, but the future is arguably more important. If you'd like to see what analysts are forecasting going forward, you should check out our free report for Jindal Stainless.
What Can We Tell From Jindal Stainless' ROCE Trend?
You'd find it hard not to be impressed with the ROCE trend at Jindal Stainless. The data shows that returns on capital have increased by 584% over the trailing five years. That's a very favorable trend because this means that the company is earning more per dollar of capital that's being employed. Speaking of capital employed, the company is actually utilizing 31% less than it was five years ago, which can be indicative of a business that's improving its efficiency. If this trend continues, the business might be getting more efficient but it's shrinking in terms of total assets.
On a separate but related note, it's important to know that Jindal Stainless has a current liabilities to total assets ratio of 41%, which we'd consider pretty high. This can bring about some risks because the company is basically operating with a rather large reliance on its suppliers or other sorts of short-term creditors. Ideally we'd like to see this reduce as that would mean fewer obligations bearing risks.What We Can Learn From Jindal Stainless' ROCE
In summary, it's great to see that Jindal Stainless has been able to turn things around and earn higher returns on lower amounts of capital. Since the stock has returned a staggering 208% to shareholders over the last five years, it looks like investors are recognizing these changes. In light of that, we think it's worth looking further into this stock because if Jindal Stainless can keep these trends up, it could have a bright future ahead.
On a final note, we've found 1 warning sign for Jindal Stainless that we think you should be aware of.
While Jindal Stainless may not currently earn the highest returns, we've compiled a list of companies that currently earn more than 25% return on equity. Check out this free list here.
If you decide to trade Jindal Stainless, use the lowest-cost* platform that is rated #1 Overall by Barron’s, Interactive Brokers. Trade stocks, options, futures, forex, bonds and funds on 135 markets, all from a single integrated account. Promoted
If you're looking to trade Jindal Stainless, open an account with the lowest-cost platform trusted by professionals, Interactive Brokers.
With clients in over 200 countries and territories, and access to 160 markets, IBKR lets you trade stocks, options, futures, forex, bonds and funds from a single integrated account.
Enjoy no hidden fees, no account minimums, and FX conversion rates as low as 0.03%, far better than what most brokers offer.
Sponsored ContentNew: Manage All Your Stock Portfolios in One Place
We've created the ultimate portfolio companion for stock investors, and it's free.
• Connect an unlimited number of Portfolios and see your total in one currency
• Be alerted to new Warning Signs or Risks via email or mobile
• Track the Fair Value of your stocks
This article by Simply Wall St is general in nature. It does not constitute a recommendation to buy or sell any stock, and does not take account of your objectives, or your financial situation. We aim to bring you long-term focused analysis driven by fundamental data. Note that our analysis may not factor in the latest price-sensitive company announcements or qualitative material. Simply Wall St has no position in any stocks mentioned.
*Interactive Brokers Rated Lowest Cost Broker by StockBrokers.com Annual Online Review 2020
Have feedback on this article? Concerned about the content? Get in touch with us directly. Alternatively, email editorial-team@simplywallst.com.
About NSEI:JSL
Jindal Stainless
Manufactures and sells stainless-steel flat products in India and internationally.
Flawless balance sheet with reasonable growth potential.
Similar Companies
Market Insights

Community Narratives

