Stock Analysis
- India
- /
- Paper and Forestry Products
- /
- NSEI:GREENPLY
Greenply Industries' (NSE:GREENPLY) five-year earnings growth trails the impressive shareholder returns


When you buy and hold a stock for the long term, you definitely want it to provide a positive return. But more than that, you probably want to see it rise more than the market average. But Greenply Industries Limited (NSE:GREENPLY) has fallen short of that second goal, with a share price rise of 94% over five years, which is below the market return. Some buyers are laughing, though, with an increase of 81% in the last year.
Since the stock has added ₹5.4b to its market cap in the past week alone, let's see if underlying performance has been driving long-term returns.
See our latest analysis for Greenply Industries
To quote Buffett, 'Ships will sail around the world but the Flat Earth Society will flourish. There will continue to be wide discrepancies between price and value in the marketplace...' One flawed but reasonable way to assess how sentiment around a company has changed is to compare the earnings per share (EPS) with the share price.
Over half a decade, Greenply Industries managed to grow its earnings per share at 1.2% a year. This EPS growth is lower than the 14% average annual increase in the share price. So it's fair to assume the market has a higher opinion of the business than it did five years ago. And that's hardly shocking given the track record of growth. This favorable sentiment is reflected in its (fairly optimistic) P/E ratio of 46.89.
The graphic below depicts how EPS has changed over time (unveil the exact values by clicking on the image).
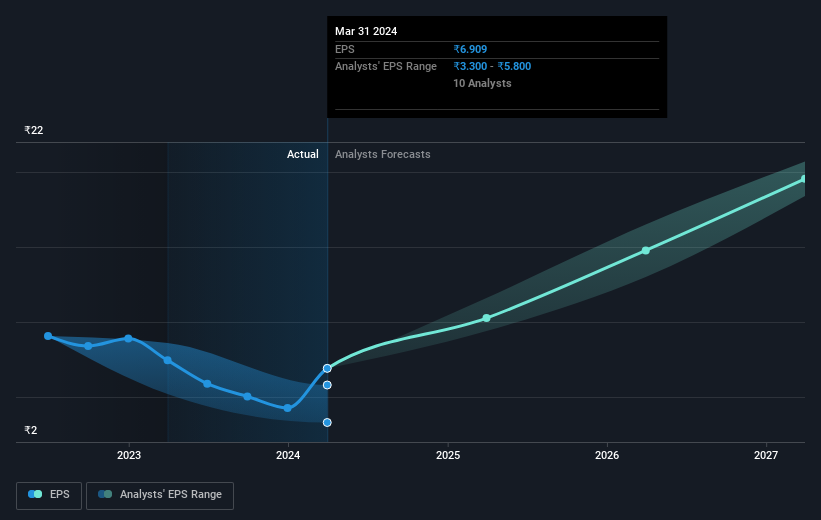
Before buying or selling a stock, we always recommend a close examination of historic growth trends, available here.
What About Dividends?
It is important to consider the total shareholder return, as well as the share price return, for any given stock. The TSR is a return calculation that accounts for the value of cash dividends (assuming that any dividend received was reinvested) and the calculated value of any discounted capital raisings and spin-offs. Arguably, the TSR gives a more comprehensive picture of the return generated by a stock. We note that for Greenply Industries the TSR over the last 5 years was 164%, which is better than the share price return mentioned above. The dividends paid by the company have thusly boosted the total shareholder return.
A Different Perspective
It's good to see that Greenply Industries has rewarded shareholders with a total shareholder return of 82% in the last twelve months. That's including the dividend. That's better than the annualised return of 21% over half a decade, implying that the company is doing better recently. In the best case scenario, this may hint at some real business momentum, implying that now could be a great time to delve deeper. While it is well worth considering the different impacts that market conditions can have on the share price, there are other factors that are even more important. Consider risks, for instance. Every company has them, and we've spotted 1 warning sign for Greenply Industries you should know about.
If you like to buy stocks alongside management, then you might just love this free list of companies. (Hint: many of them are unnoticed AND have attractive valuation).
Please note, the market returns quoted in this article reflect the market weighted average returns of stocks that currently trade on Indian exchanges.
Valuation is complex, but we're helping make it simple.
Find out whether Greenply Industries is potentially over or undervalued by checking out our comprehensive analysis, which includes fair value estimates, risks and warnings, dividends, insider transactions and financial health.
View the Free AnalysisHave feedback on this article? Concerned about the content? Get in touch with us directly. Alternatively, email editorial-team (at) simplywallst.com.
This article by Simply Wall St is general in nature. We provide commentary based on historical data and analyst forecasts only using an unbiased methodology and our articles are not intended to be financial advice. It does not constitute a recommendation to buy or sell any stock, and does not take account of your objectives, or your financial situation. We aim to bring you long-term focused analysis driven by fundamental data. Note that our analysis may not factor in the latest price-sensitive company announcements or qualitative material. Simply Wall St has no position in any stocks mentioned.
Valuation is complex, but we're helping make it simple.
Find out whether Greenply Industries is potentially over or undervalued by checking out our comprehensive analysis, which includes fair value estimates, risks and warnings, dividends, insider transactions and financial health.
View the Free AnalysisHave feedback on this article? Concerned about the content? Get in touch with us directly. Alternatively, email editorial-team@simplywallst.com
About NSEI:GREENPLY
Greenply Industries
An interior infrastructure company, manufactures, markets, trades in, and distributes plywood and allied products in India and internationally.
High growth potential with excellent balance sheet.
