- India
- /
- Metals and Mining
- /
- NSEI:GOODLUCK
Are Investors Overlooking Returns On Capital At Goodluck India (NSE:GOODLUCK)?


To find a multi-bagger stock, what are the underlying trends we should look for in a business? Firstly, we'd want to identify a growing return on capital employed (ROCE) and then alongside that, an ever-increasing base of capital employed. Put simply, these types of businesses are compounding machines, meaning they are continually reinvesting their earnings at ever-higher rates of return. Ergo, when we looked at the ROCE trends at Goodluck India (NSE:GOODLUCK), we liked what we saw.
What is Return On Capital Employed (ROCE)?
Just to clarify if you're unsure, ROCE is a metric for evaluating how much pre-tax income (in percentage terms) a company earns on the capital invested in its business. Analysts use this formula to calculate it for Goodluck India:
Return on Capital Employed = Earnings Before Interest and Tax (EBIT) ÷ (Total Assets - Current Liabilities)
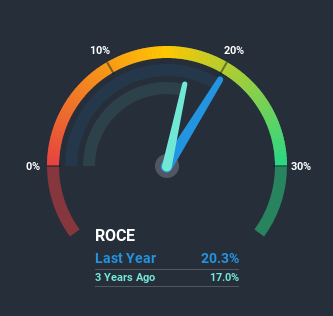
0.20 = ₹918m ÷ (₹9.8b - ₹5.2b) (Based on the trailing twelve months to December 2020).
So, Goodluck India has an ROCE of 20%. That's a fantastic return and not only that, it outpaces the average of 9.4% earned by companies in a similar industry.
Check out our latest analysis for Goodluck India
While the past is not representative of the future, it can be helpful to know how a company has performed historically, which is why we have this chart above. If you'd like to look at how Goodluck India has performed in the past in other metrics, you can view this free graph of past earnings, revenue and cash flow.
So How Is Goodluck India's ROCE Trending?
In terms of Goodluck India's history of ROCE, it's quite impressive. The company has consistently earned 20% for the last five years, and the capital employed within the business has risen 52% in that time. Now considering ROCE is an attractive 20%, this combination is actually pretty appealing because it means the business can consistently put money to work and generate these high returns. If these trends can continue, it wouldn't surprise us if the company became a multi-bagger.
On a separate but related note, it's important to know that Goodluck India has a current liabilities to total assets ratio of 54%, which we'd consider pretty high. This can bring about some risks because the company is basically operating with a rather large reliance on its suppliers or other sorts of short-term creditors. Ideally we'd like to see this reduce as that would mean fewer obligations bearing risks.
In Conclusion...
In the end, the company has proven it can reinvest it's capital at high rates of returns, which you'll remember is a trait of a multi-bagger. Yet over the last five years the stock has declined 13%, so the decline might provide an opening. That's why we think it'd be worthwhile to look further into this stock given the fundamentals are appealing.
One final note, you should learn about the 3 warning signs we've spotted with Goodluck India (including 1 which shouldn't be ignored) .
If you want to search for more stocks that have been earning high returns, check out this free list of stocks with solid balance sheets that are also earning high returns on equity.
When trading Goodluck India or any other investment, use the platform considered by many to be the Professional's Gateway to the Worlds Market, Interactive Brokers. You get the lowest-cost* trading on stocks, options, futures, forex, bonds and funds worldwide from a single integrated account. Promoted
New: Manage All Your Stock Portfolios in One Place
We've created the ultimate portfolio companion for stock investors, and it's free.
• Connect an unlimited number of Portfolios and see your total in one currency
• Be alerted to new Warning Signs or Risks via email or mobile
• Track the Fair Value of your stocks
This article by Simply Wall St is general in nature. It does not constitute a recommendation to buy or sell any stock, and does not take account of your objectives, or your financial situation. We aim to bring you long-term focused analysis driven by fundamental data. Note that our analysis may not factor in the latest price-sensitive company announcements or qualitative material. Simply Wall St has no position in any stocks mentioned.
*Interactive Brokers Rated Lowest Cost Broker by StockBrokers.com Annual Online Review 2020
Have feedback on this article? Concerned about the content? Get in touch with us directly. Alternatively, email editorial-team (at) simplywallst.com.
About NSEI:GOODLUCK
Goodluck India
Manufactures and supplies precision engineering and steel products in India.
Proven track record with adequate balance sheet.
Similar Companies
Market Insights

Community Narratives

