
Advertisement
Is Weakness In Epigral Limited (NSE:EPIGRAL) Stock A Sign That The Market Could be Wrong Given Its Strong Financial Prospects?
With its stock down 14% over the past week, it is easy to disregard Epigral (NSE:EPIGRAL). However, a closer look at its sound financials might cause you to think again. Given that fundamentals usually drive long-term market outcomes, the company is worth looking at. In this article, we decided to focus on Epigral's ROE.
Return on equity or ROE is a key measure used to assess how efficiently a company's management is utilizing the company's capital. In simpler terms, it measures the profitability of a company in relation to shareholder's equity.
View our latest analysis for Epigral
How To Calculate Return On Equity?
Return on equity can be calculated by using the formula:
Return on Equity = Net Profit (from continuing operations) ÷ Shareholders' Equity
So, based on the above formula, the ROE for Epigral is:
17% = ₹2.0b ÷ ₹11b (Based on the trailing twelve months to December 2023).
The 'return' refers to a company's earnings over the last year. One way to conceptualize this is that for each ₹1 of shareholders' capital it has, the company made ₹0.17 in profit.
What Is The Relationship Between ROE And Earnings Growth?
We have already established that ROE serves as an efficient profit-generating gauge for a company's future earnings. We now need to evaluate how much profit the company reinvests or "retains" for future growth which then gives us an idea about the growth potential of the company. Generally speaking, other things being equal, firms with a high return on equity and profit retention, have a higher growth rate than firms that don’t share these attributes.
Epigral's Earnings Growth And 17% ROE
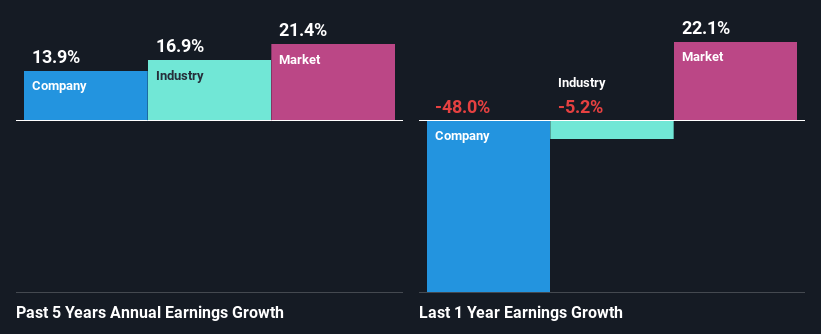
To start with, Epigral's ROE looks acceptable. On comparing with the average industry ROE of 12% the company's ROE looks pretty remarkable. This probably laid the ground for Epigral's moderate 14% net income growth seen over the past five years.
We then performed a comparison between Epigral's net income growth with the industry, which revealed that the company's growth is similar to the average industry growth of 17% in the same 5-year period.
Earnings growth is an important metric to consider when valuing a stock. It’s important for an investor to know whether the market has priced in the company's expected earnings growth (or decline). Doing so will help them establish if the stock's future looks promising or ominous. If you're wondering about Epigral's's valuation, check out this gauge of its price-to-earnings ratio, as compared to its industry.
Is Epigral Efficiently Re-investing Its Profits?
Epigral has a low three-year median payout ratio of 5.6%, meaning that the company retains the remaining 94% of its profits. This suggests that the management is reinvesting most of the profits to grow the business.
While Epigral has seen growth in its earnings, it only recently started to pay a dividend. It is most likely that the company decided to impress new and existing shareholders with a dividend.
Conclusion
Overall, we are quite pleased with Epigral's performance. Specifically, we like that the company is reinvesting a huge chunk of its profits at a high rate of return. This of course has caused the company to see substantial growth in its earnings. If the company continues to grow its earnings the way it has, that could have a positive impact on its share price given how earnings per share influence long-term share prices. Remember, the price of a stock is also dependent on the perceived risk. Therefore investors must keep themselves informed about the risks involved before investing in any company. To know the 3 risks we have identified for Epigral visit our risks dashboard for free.
Valuation is complex, but we're here to simplify it.
Discover if Epigral might be undervalued or overvalued with our detailed analysis, featuring fair value estimates, potential risks, dividends, insider trades, and its financial condition.
Access Free AnalysisHave feedback on this article? Concerned about the content? Get in touch with us directly. Alternatively, email editorial-team (at) simplywallst.com.
This article by Simply Wall St is general in nature. We provide commentary based on historical data and analyst forecasts only using an unbiased methodology and our articles are not intended to be financial advice. It does not constitute a recommendation to buy or sell any stock, and does not take account of your objectives, or your financial situation. We aim to bring you long-term focused analysis driven by fundamental data. Note that our analysis may not factor in the latest price-sensitive company announcements or qualitative material. Simply Wall St has no position in any stocks mentioned.
About NSEI:EPIGRAL
Epigral
Manufactures and sells chlor-alkali and related derivatives in India and internationally.
Outstanding track record with flawless balance sheet.
Similar Companies
Market Insights

Advertisement
Community Narratives
Finding The True Value Of A Logistics Powerhouse
Fair Value US$95.21|7.5% undervalued
NV
Community Contributor
Paradigm Biopharmaceuticals Will Lead Osteoarthritis Treatment with Zilosul's FDA Success
Fair Value AU$5.50|91.8% undervalued
AM
Community Contributor
Barrick Mining (ABX:CA): A Gold Hedge against a U.S. Shutdown
Fair Value CA$60.00|26.4% undervalued
GM
Community Contributor