
Advertisement
- India
- /
- Basic Materials
- /
- NSEI:DALBHARAT
An Intrinsic Calculation For Dalmia Bharat Limited (NSE:DALBHARAT) Suggests It's 47% Undervalued
Key Insights
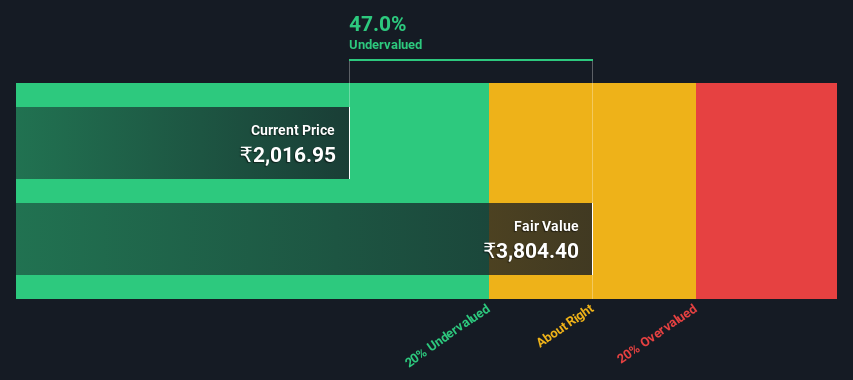
- The projected fair value for Dalmia Bharat is ₹3,804 based on 2 Stage Free Cash Flow to Equity
- Current share price of ₹2,017 suggests Dalmia Bharat is potentially 47% undervalued
- Our fair value estimate is 50% higher than Dalmia Bharat's analyst price target of ₹2,543
How far off is Dalmia Bharat Limited (NSE:DALBHARAT) from its intrinsic value? Using the most recent financial data, we'll take a look at whether the stock is fairly priced by projecting its future cash flows and then discounting them to today's value. One way to achieve this is by employing the Discounted Cash Flow (DCF) model. Don't get put off by the jargon, the math behind it is actually quite straightforward.
We would caution that there are many ways of valuing a company and, like the DCF, each technique has advantages and disadvantages in certain scenarios. Anyone interested in learning a bit more about intrinsic value should have a read of the Simply Wall St analysis model.
See our latest analysis for Dalmia Bharat
The Method
We're using the 2-stage growth model, which simply means we take in account two stages of company's growth. In the initial period the company may have a higher growth rate and the second stage is usually assumed to have a stable growth rate. To start off with, we need to estimate the next ten years of cash flows. Where possible we use analyst estimates, but when these aren't available we extrapolate the previous free cash flow (FCF) from the last estimate or reported value. We assume companies with shrinking free cash flow will slow their rate of shrinkage, and that companies with growing free cash flow will see their growth rate slow, over this period. We do this to reflect that growth tends to slow more in the early years than it does in later years.
Generally we assume that a dollar today is more valuable than a dollar in the future, so we discount the value of these future cash flows to their estimated value in today's dollars:
10-year free cash flow (FCF) estimate
| 2024 | 2025 | 2026 | 2027 | 2028 | 2029 | 2030 | 2031 | 2032 | 2033 | |
| Levered FCF (₹, Millions) | -₹13.1b | -₹11.6b | ₹6.86b | ₹15.8b | ₹30.7b | ₹51.4b | ₹76.7b | ₹104.7b | ₹133.6b | ₹162.1b |
| Growth Rate Estimate Source | Analyst x12 | Analyst x14 | Analyst x11 | Est @ 130.88% | Est @ 93.63% | Est @ 67.56% | Est @ 49.30% | Est @ 36.52% | Est @ 27.58% | Est @ 21.32% |
| Present Value (₹, Millions) Discounted @ 15% | -₹11.4k | -₹8.8k | ₹4.5k | ₹9.1k | ₹15.4k | ₹22.5k | ₹29.2k | ₹34.7k | ₹38.6k | ₹40.8k |
("Est" = FCF growth rate estimated by Simply Wall St)
Present Value of 10-year Cash Flow (PVCF) = ₹175b
After calculating the present value of future cash flows in the initial 10-year period, we need to calculate the Terminal Value, which accounts for all future cash flows beyond the first stage. For a number of reasons a very conservative growth rate is used that cannot exceed that of a country's GDP growth. In this case we have used the 5-year average of the 10-year government bond yield (6.7%) to estimate future growth. In the same way as with the 10-year 'growth' period, we discount future cash flows to today's value, using a cost of equity of 15%.
Terminal Value (TV)= FCF2033 × (1 + g) ÷ (r – g) = ₹162b× (1 + 6.7%) ÷ (15%– 6.7%) = ₹2.1t
Present Value of Terminal Value (PVTV)= TV / (1 + r)10= ₹2.1t÷ ( 1 + 15%)10= ₹539b
The total value, or equity value, is then the sum of the present value of the future cash flows, which in this case is ₹714b. To get the intrinsic value per share, we divide this by the total number of shares outstanding. Compared to the current share price of ₹2.0k, the company appears quite undervalued at a 47% discount to where the stock price trades currently. The assumptions in any calculation have a big impact on the valuation, so it is better to view this as a rough estimate, not precise down to the last cent.
Important Assumptions
Now the most important inputs to a discounted cash flow are the discount rate, and of course, the actual cash flows. Part of investing is coming up with your own evaluation of a company's future performance, so try the calculation yourself and check your own assumptions. The DCF also does not consider the possible cyclicality of an industry, or a company's future capital requirements, so it does not give a full picture of a company's potential performance. Given that we are looking at Dalmia Bharat as potential shareholders, the cost of equity is used as the discount rate, rather than the cost of capital (or weighted average cost of capital, WACC) which accounts for debt. In this calculation we've used 15%, which is based on a levered beta of 1.035. Beta is a measure of a stock's volatility, compared to the market as a whole. We get our beta from the industry average beta of globally comparable companies, with an imposed limit between 0.8 and 2.0, which is a reasonable range for a stable business.
SWOT Analysis for Dalmia Bharat
Strength
- Debt is not viewed as a risk.
Weakness
- Earnings growth over the past year underperformed the Basic Materials industry.
- Dividend is low compared to the top 25% of dividend payers in the Basic Materials market.
Opportunity
- Annual earnings are forecast to grow faster than the Indian market.
- Trading below our estimate of fair value by more than 20%.
Threat
- Paying a dividend but company has no free cash flows.
- Revenue is forecast to grow slower than 20% per year.
Moving On:
Valuation is only one side of the coin in terms of building your investment thesis, and it is only one of many factors that you need to assess for a company. The DCF model is not a perfect stock valuation tool. Instead the best use for a DCF model is to test certain assumptions and theories to see if they would lead to the company being undervalued or overvalued. For instance, if the terminal value growth rate is adjusted slightly, it can dramatically alter the overall result. Why is the intrinsic value higher than the current share price? For Dalmia Bharat, there are three pertinent factors you should assess:
- Risks: We feel that you should assess the 1 warning sign for Dalmia Bharat we've flagged before making an investment in the company.
- Future Earnings: How does DALBHARAT's growth rate compare to its peers and the wider market? Dig deeper into the analyst consensus number for the upcoming years by interacting with our free analyst growth expectation chart.
- Other High Quality Alternatives: Do you like a good all-rounder? Explore our interactive list of high quality stocks to get an idea of what else is out there you may be missing!
PS. Simply Wall St updates its DCF calculation for every Indian stock every day, so if you want to find the intrinsic value of any other stock just search here.
New: Manage All Your Stock Portfolios in One Place
We've created the ultimate portfolio companion for stock investors, and it's free.
• Connect an unlimited number of Portfolios and see your total in one currency
• Be alerted to new Warning Signs or Risks via email or mobile
• Track the Fair Value of your stocks
Have feedback on this article? Concerned about the content? Get in touch with us directly. Alternatively, email editorial-team (at) simplywallst.com.
This article by Simply Wall St is general in nature. We provide commentary based on historical data and analyst forecasts only using an unbiased methodology and our articles are not intended to be financial advice. It does not constitute a recommendation to buy or sell any stock, and does not take account of your objectives, or your financial situation. We aim to bring you long-term focused analysis driven by fundamental data. Note that our analysis may not factor in the latest price-sensitive company announcements or qualitative material. Simply Wall St has no position in any stocks mentioned.
About NSEI:DALBHARAT
Dalmia Bharat
Manufactures and sells cement and its related products primarily in India.
Flawless balance sheet with solid track record.
Similar Companies
Market Insights

Advertisement
Community Narratives
100% Patient Improvement in trial puts this $16M Biotech on the radar
Fair Value US$5.30|69.8% undervalued
JO
Community Contributor
Exxon Mobil's 17.5% Upside Promises Industry-Leading Returns in Energy Transition
Fair Value US$132.00|15.0% undervalued
HE
Community Contributor
NHC Analysis: Quality at a Good Price. A Golden Opportunity?
Fair Value US$179.80|36.1% undervalued
DA
Community Contributor
Product Refresh And Global Expansion Will Empower Future Market Leadership
Fair Value US$202.60|21.1% undervalued
AN
Based on Analyst Price Targets