
Advertisement
- India
- /
- Metals and Mining
- /
- NSEI:BMETRICS
Bombay Metrics Supply Chain Limited (NSE:BMETRICS) Investors Are Less Pessimistic Than Expected
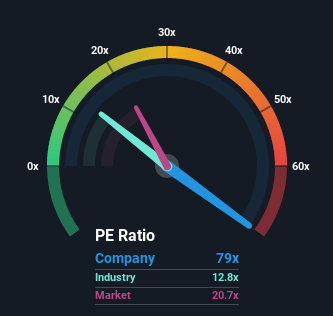
Bombay Metrics Supply Chain Limited's (NSE:BMETRICS) price-to-earnings (or "P/E") ratio of 79x might make it look like a strong sell right now compared to the market in India, where around half of the companies have P/E ratios below 20x and even P/E's below 10x are quite common. Nonetheless, we'd need to dig a little deeper to determine if there is a rational basis for the highly elevated P/E.
As an illustration, earnings have deteriorated at Bombay Metrics Supply Chain over the last year, which is not ideal at all. It might be that many expect the company to still outplay most other companies over the coming period, which has kept the P/E from collapsing. If not, then existing shareholders may be quite nervous about the viability of the share price.
Check out our latest analysis for Bombay Metrics Supply Chain
What Are Growth Metrics Telling Us About The High P/E?
Bombay Metrics Supply Chain's P/E ratio would be typical for a company that's expected to deliver very strong growth, and importantly, perform much better than the market.
Taking a look back first, the company's earnings per share growth last year wasn't something to get excited about as it posted a disappointing decline of 47%. As a result, earnings from three years ago have also fallen 54% overall. Therefore, it's fair to say the earnings growth recently has been undesirable for the company.
Weighing that medium-term earnings trajectory against the broader market's one-year forecast for expansion of 22% shows it's an unpleasant look.
With this information, we find it concerning that Bombay Metrics Supply Chain is trading at a P/E higher than the market. Apparently many investors in the company are way more bullish than recent times would indicate and aren't willing to let go of their stock at any price. There's a very good chance existing shareholders are setting themselves up for future disappointment if the P/E falls to levels more in line with the recent negative growth rates.
The Bottom Line On Bombay Metrics Supply Chain's P/E
Typically, we'd caution against reading too much into price-to-earnings ratios when settling on investment decisions, though it can reveal plenty about what other market participants think about the company.
We've established that Bombay Metrics Supply Chain currently trades on a much higher than expected P/E since its recent earnings have been in decline over the medium-term. When we see earnings heading backwards and underperforming the market forecasts, we suspect the share price is at risk of declining, sending the high P/E lower. Unless the recent medium-term conditions improve markedly, it's very challenging to accept these prices as being reasonable.
There are also other vital risk factors to consider and we've discovered 3 warning signs for Bombay Metrics Supply Chain (1 is significant!) that you should be aware of before investing here.
You might be able to find a better investment than Bombay Metrics Supply Chain. If you want a selection of possible candidates, check out this free list of interesting companies that trade on a P/E below 20x (but have proven they can grow earnings).
Valuation is complex, but we're here to simplify it.
Discover if Bombay Metrics Supply Chain might be undervalued or overvalued with our detailed analysis, featuring fair value estimates, potential risks, dividends, insider trades, and its financial condition.
Access Free AnalysisHave feedback on this article? Concerned about the content? Get in touch with us directly. Alternatively, email editorial-team (at) simplywallst.com.
This article by Simply Wall St is general in nature. We provide commentary based on historical data and analyst forecasts only using an unbiased methodology and our articles are not intended to be financial advice. It does not constitute a recommendation to buy or sell any stock, and does not take account of your objectives, or your financial situation. We aim to bring you long-term focused analysis driven by fundamental data. Note that our analysis may not factor in the latest price-sensitive company announcements or qualitative material. Simply Wall St has no position in any stocks mentioned.
About NSEI:BMETRICS
Bombay Metrics Supply Chain
Together with its subsidiary, Metrics Vietnam Company Limited, provides manufacturing and trading of engineering tools and components, and supply chain management services in India and internationally.
Solid track record with moderate risk.
Market Insights

Advertisement
Community Narratives
Finding The True Value Of A Logistics Powerhouse
Fair Value US$95.21|8.7% undervalued
NV
Community Contributor
Paradigm Biopharmaceuticals Will Lead Osteoarthritis Treatment with Zilosul's FDA Success
Fair Value AU$5.50|93.3% undervalued
AM
Community Contributor
Barrick Mining (ABX:CA): A Gold Hedge against a U.S. Shutdown
Fair Value CA$60.00|18.7% undervalued
GM
Community Contributor