
Advertisement
Bayer CropScience (NSE:BAYERCROP) jumps 5.4% this week, though earnings growth is still tracking behind five-year shareholder returns
When you buy and hold a stock for the long term, you definitely want it to provide a positive return. Furthermore, you'd generally like to see the share price rise faster than the market. But Bayer CropScience Limited (NSE:BAYERCROP) has fallen short of that second goal, with a share price rise of 99% over five years, which is below the market return. On a brighter note, more newer shareholders are probably rather content with the 26% share price gain over twelve months.
Since it's been a strong week for Bayer CropScience shareholders, let's have a look at trend of the longer term fundamentals.
View our latest analysis for Bayer CropScience
To paraphrase Benjamin Graham: Over the short term the market is a voting machine, but over the long term it's a weighing machine. By comparing earnings per share (EPS) and share price changes over time, we can get a feel for how investor attitudes to a company have morphed over time.
Over half a decade, Bayer CropScience managed to grow its earnings per share at 28% a year. The EPS growth is more impressive than the yearly share price gain of 15% over the same period. So it seems the market isn't so enthusiastic about the stock these days.
The image below shows how EPS has tracked over time (if you click on the image you can see greater detail).
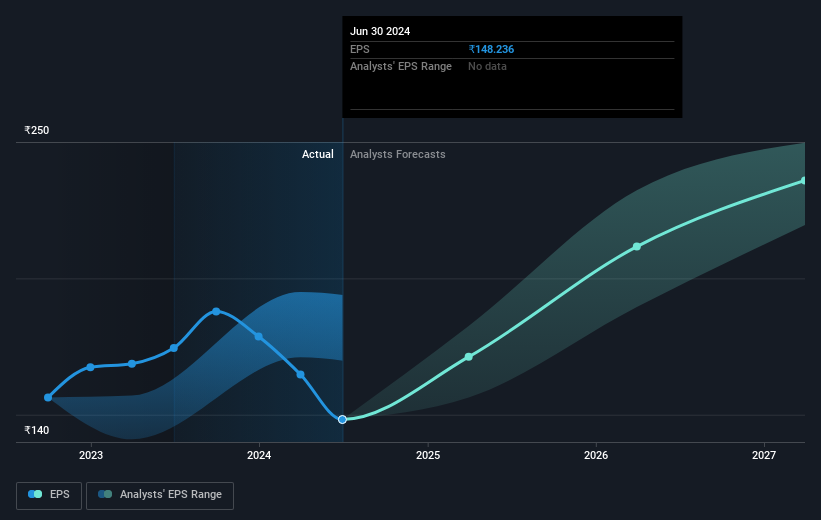
Dive deeper into Bayer CropScience's key metrics by checking this interactive graph of Bayer CropScience's earnings, revenue and cash flow.
What About Dividends?
When looking at investment returns, it is important to consider the difference between total shareholder return (TSR) and share price return. Whereas the share price return only reflects the change in the share price, the TSR includes the value of dividends (assuming they were reinvested) and the benefit of any discounted capital raising or spin-off. It's fair to say that the TSR gives a more complete picture for stocks that pay a dividend. In the case of Bayer CropScience, it has a TSR of 121% for the last 5 years. That exceeds its share price return that we previously mentioned. This is largely a result of its dividend payments!
A Different Perspective
Bayer CropScience shareholders gained a total return of 29% during the year. But that return falls short of the market. The silver lining is that the gain was actually better than the average annual return of 17% per year over five year. This suggests the company might be improving over time. It's always interesting to track share price performance over the longer term. But to understand Bayer CropScience better, we need to consider many other factors. For example, we've discovered 1 warning sign for Bayer CropScience that you should be aware of before investing here.
If you are like me, then you will not want to miss this free list of undervalued small caps that insiders are buying.
Please note, the market returns quoted in this article reflect the market weighted average returns of stocks that currently trade on Indian exchanges.
Valuation is complex, but we're here to simplify it.
Discover if Bayer CropScience might be undervalued or overvalued with our detailed analysis, featuring fair value estimates, potential risks, dividends, insider trades, and its financial condition.
Access Free AnalysisHave feedback on this article? Concerned about the content? Get in touch with us directly. Alternatively, email editorial-team (at) simplywallst.com.
This article by Simply Wall St is general in nature. We provide commentary based on historical data and analyst forecasts only using an unbiased methodology and our articles are not intended to be financial advice. It does not constitute a recommendation to buy or sell any stock, and does not take account of your objectives, or your financial situation. We aim to bring you long-term focused analysis driven by fundamental data. Note that our analysis may not factor in the latest price-sensitive company announcements or qualitative material. Simply Wall St has no position in any stocks mentioned.
About NSEI:BAYERCROP
Bayer CropScience
Engages in the manufacture, sale, and distribution of insecticides, fungicides, herbicides, and various other agrochemical products and hybrid corn seeds in India, Germany, Bangladesh, and internationally.
Flawless balance sheet with moderate growth potential.
Similar Companies
Market Insights

Advertisement
Community Narratives
MINISO's fair value is projected at 26.69 with an anticipated PE ratio shift of 20x
Fair Value US$24.03|11.0% undervalued
BE
Community Contributor
Procter & Gamble: A Dividend Giant Facing Slowing Growth
Fair Value US$119.81|23.3% overvalued
AN
Community Contributor
Eli Lilly's Future Growth Driven by Tirzepatide and Favorable Market Conditions
Fair Value US$1.19k|13.8% undervalued
EA
Community Contributor