- India
- /
- Metals and Mining
- /
- NSEI:APLAPOLLO
APL Apollo Tubes Limited's (NSE:APLAPOLLO) Stock Is Going Strong: Is the Market Following Fundamentals?


APL Apollo Tubes (NSE:APLAPOLLO) has had a great run on the share market with its stock up by a significant 42% over the last three months. Since the market usually pay for a company’s long-term fundamentals, we decided to study the company’s key performance indicators to see if they could be influencing the market. Specifically, we decided to study APL Apollo Tubes' ROE in this article.
Return on equity or ROE is an important factor to be considered by a shareholder because it tells them how effectively their capital is being reinvested. Simply put, it is used to assess the profitability of a company in relation to its equity capital.
Check out our latest analysis for APL Apollo Tubes
How Is ROE Calculated?
Return on equity can be calculated by using the formula:
Return on Equity = Net Profit (from continuing operations) ÷ Shareholders' Equity
So, based on the above formula, the ROE for APL Apollo Tubes is:
22% = ₹3.3b ÷ ₹15b (Based on the trailing twelve months to December 2020).
The 'return' is the income the business earned over the last year. That means that for every ₹1 worth of shareholders' equity, the company generated ₹0.22 in profit.
What Has ROE Got To Do With Earnings Growth?
So far, we've learned that ROE is a measure of a company's profitability. We now need to evaluate how much profit the company reinvests or "retains" for future growth which then gives us an idea about the growth potential of the company. Generally speaking, other things being equal, firms with a high return on equity and profit retention, have a higher growth rate than firms that don’t share these attributes.
APL Apollo Tubes' Earnings Growth And 22% ROE
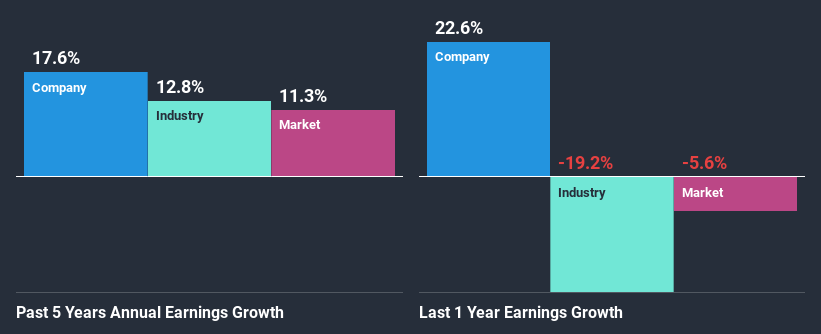
At first glance, APL Apollo Tubes seems to have a decent ROE. Especially when compared to the industry average of 7.3% the company's ROE looks pretty impressive. Probably as a result of this, APL Apollo Tubes was able to see a decent growth of 18% over the last five years.
As a next step, we compared APL Apollo Tubes' net income growth with the industry, and pleasingly, we found that the growth seen by the company is higher than the average industry growth of 13%.
The basis for attaching value to a company is, to a great extent, tied to its earnings growth. It’s important for an investor to know whether the market has priced in the company's expected earnings growth (or decline). This then helps them determine if the stock is placed for a bright or bleak future. If you're wondering about APL Apollo Tubes''s valuation, check out this gauge of its price-to-earnings ratio, as compared to its industry.
Is APL Apollo Tubes Efficiently Re-investing Its Profits?
While the company did pay out a portion of its dividend in the past, it currently doesn't pay a dividend. We infer that the company has been reinvesting all of its profits to grow its business.
Conclusion
Overall, we are quite pleased with APL Apollo Tubes' performance. In particular, it's great to see that the company is investing heavily into its business and along with a high rate of return, that has resulted in a sizeable growth in its earnings. That being so, the latest analyst forecasts show that the company will continue to see an expansion in its earnings. To know more about the company's future earnings growth forecasts take a look at this free report on analyst forecasts for the company to find out more.
If you decide to trade APL Apollo Tubes, use the lowest-cost* platform that is rated #1 Overall by Barron’s, Interactive Brokers. Trade stocks, options, futures, forex, bonds and funds on 135 markets, all from a single integrated account. Promoted
New: Manage All Your Stock Portfolios in One Place
We've created the ultimate portfolio companion for stock investors, and it's free.
• Connect an unlimited number of Portfolios and see your total in one currency
• Be alerted to new Warning Signs or Risks via email or mobile
• Track the Fair Value of your stocks
This article by Simply Wall St is general in nature. It does not constitute a recommendation to buy or sell any stock, and does not take account of your objectives, or your financial situation. We aim to bring you long-term focused analysis driven by fundamental data. Note that our analysis may not factor in the latest price-sensitive company announcements or qualitative material. Simply Wall St has no position in any stocks mentioned.
*Interactive Brokers Rated Lowest Cost Broker by StockBrokers.com Annual Online Review 2020
Have feedback on this article? Concerned about the content? Get in touch with us directly. Alternatively, email editorial-team (at) simplywallst.com.
About NSEI:APLAPOLLO
Flawless balance sheet with high growth potential and pays a dividend.
Similar Companies
Market Insights

Community Narratives

