
Advertisement
AksharChem (India) (NSE:AKSHARCHEM) Will Be Looking To Turn Around Its Returns
When we're researching a company, it's sometimes hard to find the warning signs, but there are some financial metrics that can help spot trouble early. Typically, we'll see the trend of both return on capital employed (ROCE) declining and this usually coincides with a decreasing amount of capital employed. This indicates the company is producing less profit from its investments and its total assets are decreasing. On that note, looking into AksharChem (India) (NSE:AKSHARCHEM), we weren't too upbeat about how things were going.
Understanding Return On Capital Employed (ROCE)
For those who don't know, ROCE is a measure of a company's yearly pre-tax profit (its return), relative to the capital employed in the business. To calculate this metric for AksharChem (India), this is the formula:
Return on Capital Employed = Earnings Before Interest and Tax (EBIT) ÷ (Total Assets - Current Liabilities)
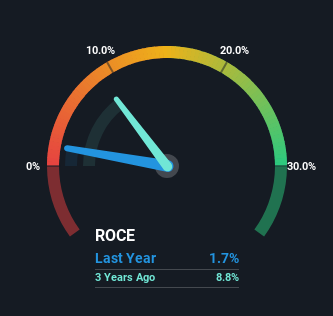
0.017 = ₹50m ÷ (₹4.0b - ₹972m) (Based on the trailing twelve months to December 2024).
So, AksharChem (India) has an ROCE of 1.7%. Ultimately, that's a low return and it under-performs the Chemicals industry average of 13%.
Check out our latest analysis for AksharChem (India)
While the past is not representative of the future, it can be helpful to know how a company has performed historically, which is why we have this chart above. If you want to delve into the historical earnings , check out these free graphs detailing revenue and cash flow performance of AksharChem (India).
So How Is AksharChem (India)'s ROCE Trending?
In terms of AksharChem (India)'s historical ROCE movements, the trend doesn't inspire confidence. About five years ago, returns on capital were 5.2%, however they're now substantially lower than that as we saw above. On top of that, it's worth noting that the amount of capital employed within the business has remained relatively steady. Companies that exhibit these attributes tend to not be shrinking, but they can be mature and facing pressure on their margins from competition. So because these trends aren't typically conducive to creating a multi-bagger, we wouldn't hold our breath on AksharChem (India) becoming one if things continue as they have.
On a side note, AksharChem (India)'s current liabilities have increased over the last five years to 24% of total assets, effectively distorting the ROCE to some degree. Without this increase, it's likely that ROCE would be even lower than 1.7%. While the ratio isn't currently too high, it's worth keeping an eye on this because if it gets particularly high, the business could then face some new elements of risk.
Our Take On AksharChem (India)'s ROCE
All in all, the lower returns from the same amount of capital employed aren't exactly signs of a compounding machine. Despite the concerning underlying trends, the stock has actually gained 36% over the last five years, so it might be that the investors are expecting the trends to reverse. Either way, we aren't huge fans of the current trends and so with that we think you might find better investments elsewhere.
AksharChem (India) does have some risks, we noticed 2 warning signs (and 1 which is potentially serious) we think you should know about.
While AksharChem (India) may not currently earn the highest returns, we've compiled a list of companies that currently earn more than 25% return on equity. Check out this free list here.
New: Manage All Your Stock Portfolios in One Place
We've created the ultimate portfolio companion for stock investors, and it's free.
• Connect an unlimited number of Portfolios and see your total in one currency
• Be alerted to new Warning Signs or Risks via email or mobile
• Track the Fair Value of your stocks
Have feedback on this article? Concerned about the content? Get in touch with us directly. Alternatively, email editorial-team (at) simplywallst.com.
This article by Simply Wall St is general in nature. We provide commentary based on historical data and analyst forecasts only using an unbiased methodology and our articles are not intended to be financial advice. It does not constitute a recommendation to buy or sell any stock, and does not take account of your objectives, or your financial situation. We aim to bring you long-term focused analysis driven by fundamental data. Note that our analysis may not factor in the latest price-sensitive company announcements or qualitative material. Simply Wall St has no position in any stocks mentioned.
About NSEI:AKSHARCHEM
AksharChem (India)
Manufactures and sells dyes intermediates, pigments, and inorganic chemicals in India.
Adequate balance sheet with low risk.
Similar Companies
Market Insights

Advertisement
Community Narratives
Finding The True Value Of A Logistics Powerhouse
Fair Value US$95.21|7.5% undervalued
NV
Community Contributor
Paradigm Biopharmaceuticals Will Lead Osteoarthritis Treatment with Zilosul's FDA Success
Fair Value AU$5.50|91.8% undervalued
AM
Community Contributor
Barrick Mining (ABX:CA): A Gold Hedge against a U.S. Shutdown
Fair Value CA$60.00|26.4% undervalued
GM
Community Contributor