
Advertisement
Further Upside For Agro Phos (India) Limited (NSE:AGROPHOS) Shares Could Introduce Price Risks After 25% Bounce

Agro Phos (India) Limited (NSE:AGROPHOS) shareholders are no doubt pleased to see that the share price has bounced 25% in the last month, although it is still struggling to make up recently lost ground. Taking a wider view, although not as strong as the last month, the full year gain of 20% is also fairly reasonable.
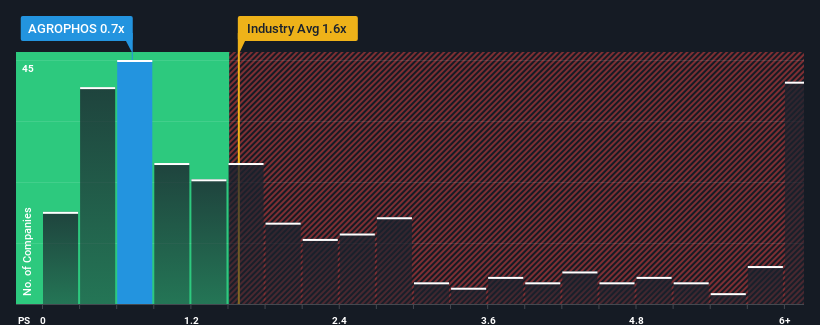
Even after such a large jump in price, Agro Phos (India) may still be sending bullish signals at the moment with its price-to-sales (or "P/S") ratio of 0.7x, since almost half of all companies in the Chemicals industry in India have P/S ratios greater than 1.6x and even P/S higher than 4x are not unusual. However, the P/S might be low for a reason and it requires further investigation to determine if it's justified.
Check out our latest analysis for Agro Phos (India)
How Has Agro Phos (India) Performed Recently?
We'd have to say that with no tangible growth over the last year, Agro Phos (India)'s revenue has been unimpressive. Perhaps the market believes the recent lacklustre revenue performance is a sign of future underperformance relative to industry peers, hurting the P/S. If you like the company, you'd be hoping this isn't the case so that you could potentially pick up some stock while it's out of favour.
Although there are no analyst estimates available for Agro Phos (India), take a look at this free data-rich visualisation to see how the company stacks up on earnings, revenue and cash flow.What Are Revenue Growth Metrics Telling Us About The Low P/S?
Agro Phos (India)'s P/S ratio would be typical for a company that's only expected to deliver limited growth, and importantly, perform worse than the industry.
If we review the last year of revenue, the company posted a result that saw barely any deviation from a year ago. Still, the latest three year period has seen an excellent 85% overall rise in revenue, in spite of its uninspiring short-term performance. Therefore, it's fair to say the revenue growth recently has been great for the company, but investors will want to ask why it has slowed to such an extent.
Comparing that to the industry, which is only predicted to deliver 12% growth in the next 12 months, the company's momentum is stronger based on recent medium-term annualised revenue results.
With this in mind, we find it intriguing that Agro Phos (India)'s P/S isn't as high compared to that of its industry peers. It looks like most investors are not convinced the company can maintain its recent growth rates.
The Key Takeaway
Despite Agro Phos (India)'s share price climbing recently, its P/S still lags most other companies. Typically, we'd caution against reading too much into price-to-sales ratios when settling on investment decisions, though it can reveal plenty about what other market participants think about the company.
Our examination of Agro Phos (India) revealed its three-year revenue trends aren't boosting its P/S anywhere near as much as we would have predicted, given they look better than current industry expectations. When we see robust revenue growth that outpaces the industry, we presume that there are notable underlying risks to the company's future performance, which is exerting downward pressure on the P/S ratio. At least price risks look to be very low if recent medium-term revenue trends continue, but investors seem to think future revenue could see a lot of volatility.
Plus, you should also learn about these 3 warning signs we've spotted with Agro Phos (India) (including 2 which shouldn't be ignored).
If these risks are making you reconsider your opinion on Agro Phos (India), explore our interactive list of high quality stocks to get an idea of what else is out there.
New: Manage All Your Stock Portfolios in One Place
We've created the ultimate portfolio companion for stock investors, and it's free.
• Connect an unlimited number of Portfolios and see your total in one currency
• Be alerted to new Warning Signs or Risks via email or mobile
• Track the Fair Value of your stocks
Have feedback on this article? Concerned about the content? Get in touch with us directly. Alternatively, email editorial-team (at) simplywallst.com.
This article by Simply Wall St is general in nature. We provide commentary based on historical data and analyst forecasts only using an unbiased methodology and our articles are not intended to be financial advice. It does not constitute a recommendation to buy or sell any stock, and does not take account of your objectives, or your financial situation. We aim to bring you long-term focused analysis driven by fundamental data. Note that our analysis may not factor in the latest price-sensitive company announcements or qualitative material. Simply Wall St has no position in any stocks mentioned.
About NSEI:AGROPHOS
Agro Phos (India)
Engages in the manufacture and sale of fertilizers in India.
Adequate balance sheet low.
Market Insights

Advertisement
Community Narratives
Groundbreaking therapies that could change the treatment landscape for PTSD, fibromyalgia, MS & Alzheimer’s
Fair Value US$6.20|86.9% undervalued
CM
Community Contributor
DigitalOcean Will Grow 14% by Embracing AI with Paperspace Acquisition
Fair Value US$50.00|40.2% undervalued
NE
Community Contributor
Viant Technology: A Rising AdTech Challenger in the AI-Powered CTV Market
Fair Value US$38.61|62.7% undervalued
BL
Community Contributor
Volvo will Accelerate Forward into Electric and Autonomous Leadership in Five Years
Fair Value SEK 438.80|40.1% undervalued
UN
Community Contributor