
Advertisement
The five-year decline in earnings for Aarti Industries NSE:AARTIIND) isn't encouraging, but shareholders are still up 109% over that period
When you buy and hold a stock for the long term, you definitely want it to provide a positive return. But more than that, you probably want to see it rise more than the market average. Unfortunately for shareholders, while the Aarti Industries Limited (NSE:AARTIIND) share price is up 84% in the last five years, that's less than the market return. However, more recent buyers should be happy with the increase of 29% over the last year.
Although Aarti Industries has shed ₹9.1b from its market cap this week, let's take a look at its longer term fundamental trends and see if they've driven returns.
Check out our latest analysis for Aarti Industries
To paraphrase Benjamin Graham: Over the short term the market is a voting machine, but over the long term it's a weighing machine. One way to examine how market sentiment has changed over time is to look at the interaction between a company's share price and its earnings per share (EPS).
Aarti Industries' earnings per share are down 3.4% per year, despite strong share price performance over five years.
So it's hard to argue that the earnings per share are the best metric to judge the company, as it may not be optimized for profits at this point. Since the change in EPS doesn't seem to correlate with the change in share price, it's worth taking a look at other metrics.
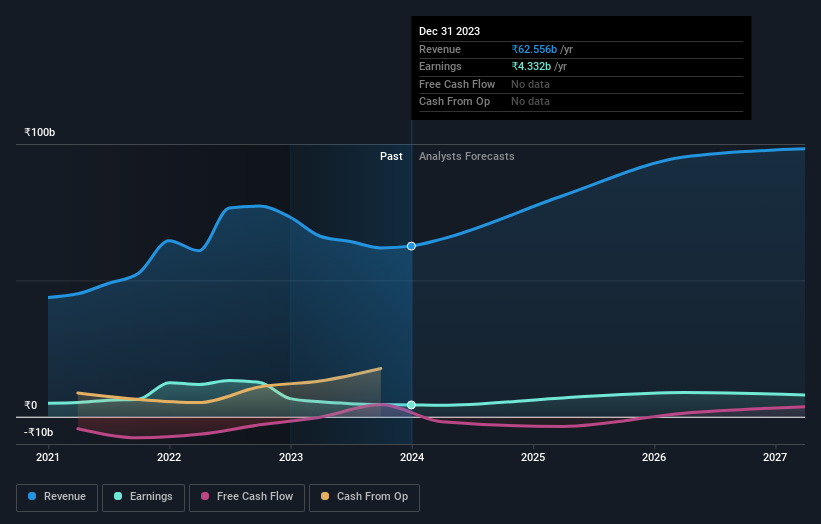
The modest 0.3% dividend yield is unlikely to be propping up the share price. On the other hand, Aarti Industries' revenue is growing nicely, at a compound rate of 13% over the last five years. It's quite possible that management are prioritizing revenue growth over EPS growth at the moment.
The graphic below depicts how earnings and revenue have changed over time (unveil the exact values by clicking on the image).
Aarti Industries is a well known stock, with plenty of analyst coverage, suggesting some visibility into future growth. If you are thinking of buying or selling Aarti Industries stock, you should check out this free report showing analyst consensus estimates for future profits.
What About Dividends?
As well as measuring the share price return, investors should also consider the total shareholder return (TSR). Whereas the share price return only reflects the change in the share price, the TSR includes the value of dividends (assuming they were reinvested) and the benefit of any discounted capital raising or spin-off. It's fair to say that the TSR gives a more complete picture for stocks that pay a dividend. As it happens, Aarti Industries' TSR for the last 5 years was 109%, which exceeds the share price return mentioned earlier. And there's no prize for guessing that the dividend payments largely explain the divergence!
A Different Perspective
Aarti Industries shareholders gained a total return of 29% during the year. Unfortunately this falls short of the market return. The silver lining is that the gain was actually better than the average annual return of 16% per year over five year. It is possible that returns will improve along with the business fundamentals. It's always interesting to track share price performance over the longer term. But to understand Aarti Industries better, we need to consider many other factors. Consider risks, for instance. Every company has them, and we've spotted 2 warning signs for Aarti Industries you should know about.
We will like Aarti Industries better if we see some big insider buys. While we wait, check out this free list of growing companies with considerable, recent, insider buying.
Please note, the market returns quoted in this article reflect the market weighted average returns of stocks that currently trade on Indian exchanges.
New: Manage All Your Stock Portfolios in One Place
We've created the ultimate portfolio companion for stock investors, and it's free.
• Connect an unlimited number of Portfolios and see your total in one currency
• Be alerted to new Warning Signs or Risks via email or mobile
• Track the Fair Value of your stocks
Have feedback on this article? Concerned about the content? Get in touch with us directly. Alternatively, email editorial-team (at) simplywallst.com.
This article by Simply Wall St is general in nature. We provide commentary based on historical data and analyst forecasts only using an unbiased methodology and our articles are not intended to be financial advice. It does not constitute a recommendation to buy or sell any stock, and does not take account of your objectives, or your financial situation. We aim to bring you long-term focused analysis driven by fundamental data. Note that our analysis may not factor in the latest price-sensitive company announcements or qualitative material. Simply Wall St has no position in any stocks mentioned.
About NSEI:AARTIIND
Aarti Industries
Engages in the manufacture and sale of specialty chemicals in India and internationally.
Reasonable growth potential with mediocre balance sheet.
Market Insights

Advertisement
Community Narratives
Finding The True Value Of A Logistics Powerhouse
Fair Value US$95.21|8.4% undervalued
NV
Community Contributor
Paradigm Biopharmaceuticals Will Lead Osteoarthritis Treatment with Zilosul's FDA Success
Fair Value AU$5.50|92.1% undervalued
AM
Community Contributor
Barrick Mining (ABX:CA): A Gold Hedge against a U.S. Shutdown
Fair Value CA$60.00|24.2% undervalued
GM
Community Contributor