
Advertisement
- India
- /
- Personal Products
- /
- NSEI:PGHH
Investors in Procter & Gamble Hygiene and Health Care (NSE:PGHH) have seen notable returns of 50% over the past five years

When you buy and hold a stock for the long term, you definitely want it to provide a positive return. Better yet, you'd like to see the share price move up more than the market average. But Procter & Gamble Hygiene and Health Care Limited (NSE:PGHH) has fallen short of that second goal, with a share price rise of 38% over five years, which is below the market return. Zooming in, the stock is actually down 11% in the last year.
Now it's worth having a look at the company's fundamentals too, because that will help us determine if the long term shareholder return has matched the performance of the underlying business.
In his essay The Superinvestors of Graham-and-Doddsville Warren Buffett described how share prices do not always rationally reflect the value of a business. By comparing earnings per share (EPS) and share price changes over time, we can get a feel for how investor attitudes to a company have morphed over time.
During five years of share price growth, Procter & Gamble Hygiene and Health Care achieved compound earnings per share (EPS) growth of 11% per year. This EPS growth is higher than the 7% average annual increase in the share price. Therefore, it seems the market has become relatively pessimistic about the company. Of course, with a P/E ratio of 63.19, the market remains optimistic.
The graphic below depicts how EPS has changed over time (unveil the exact values by clicking on the image).
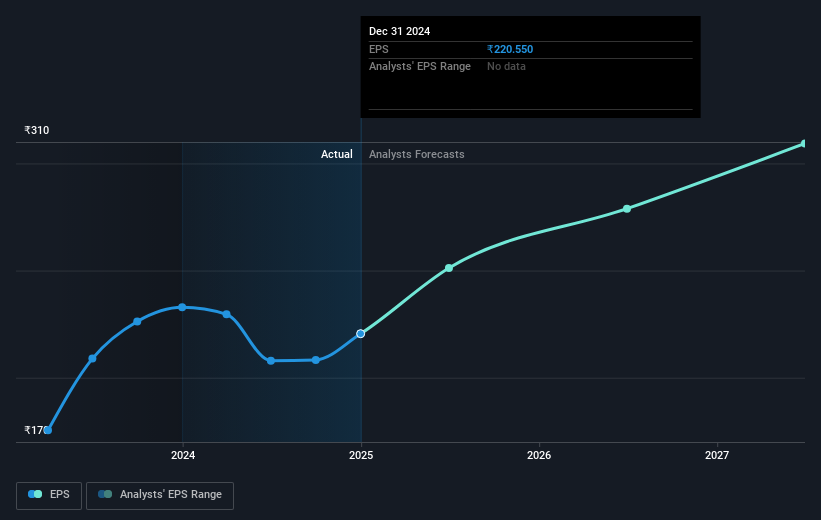
Dive deeper into Procter & Gamble Hygiene and Health Care's key metrics by checking this interactive graph of Procter & Gamble Hygiene and Health Care's earnings, revenue and cash flow.
What About Dividends?
As well as measuring the share price return, investors should also consider the total shareholder return (TSR). Whereas the share price return only reflects the change in the share price, the TSR includes the value of dividends (assuming they were reinvested) and the benefit of any discounted capital raising or spin-off. Arguably, the TSR gives a more comprehensive picture of the return generated by a stock. We note that for Procter & Gamble Hygiene and Health Care the TSR over the last 5 years was 50%, which is better than the share price return mentioned above. This is largely a result of its dividend payments!
A Different Perspective
Procter & Gamble Hygiene and Health Care shareholders are down 10% for the year (even including dividends), but the market itself is up 3.0%. Even the share prices of good stocks drop sometimes, but we want to see improvements in the fundamental metrics of a business, before getting too interested. Longer term investors wouldn't be so upset, since they would have made 8%, each year, over five years. It could be that the recent sell-off is an opportunity, so it may be worth checking the fundamental data for signs of a long term growth trend. I find it very interesting to look at share price over the long term as a proxy for business performance. But to truly gain insight, we need to consider other information, too. Even so, be aware that Procter & Gamble Hygiene and Health Care is showing 2 warning signs in our investment analysis , you should know about...
But note: Procter & Gamble Hygiene and Health Care may not be the best stock to buy. So take a peek at this free list of interesting companies with past earnings growth (and further growth forecast).
Please note, the market returns quoted in this article reflect the market weighted average returns of stocks that currently trade on Indian exchanges.
New: Manage All Your Stock Portfolios in One Place
We've created the ultimate portfolio companion for stock investors, and it's free.
• Connect an unlimited number of Portfolios and see your total in one currency
• Be alerted to new Warning Signs or Risks via email or mobile
• Track the Fair Value of your stocks
Have feedback on this article? Concerned about the content? Get in touch with us directly. Alternatively, email editorial-team (at) simplywallst.com.
This article by Simply Wall St is general in nature. We provide commentary based on historical data and analyst forecasts only using an unbiased methodology and our articles are not intended to be financial advice. It does not constitute a recommendation to buy or sell any stock, and does not take account of your objectives, or your financial situation. We aim to bring you long-term focused analysis driven by fundamental data. Note that our analysis may not factor in the latest price-sensitive company announcements or qualitative material. Simply Wall St has no position in any stocks mentioned.
About NSEI:PGHH
Procter & Gamble Hygiene and Health Care
Engages in the manufacture and sale of branded packaged fast-moving consumer goods in the feminine care and healthcare businesses in India and internationally.
Flawless balance sheet second-rate dividend payer.
Market Insights

Advertisement
Community Narratives
Groundbreaking therapies that could change the treatment landscape for PTSD, fibromyalgia, MS & Alzheimer’s
Fair Value US$6.20|86.9% undervalued
CM
Community Contributor
DigitalOcean Will Grow 14% by Embracing AI with Paperspace Acquisition
Fair Value US$50.00|41.7% undervalued
NE
Community Contributor
Viant Technology: A Rising AdTech Challenger in the AI-Powered CTV Market
Fair Value US$38.61|63.2% undervalued
BL
Community Contributor
Volvo will Accelerate Forward into Electric and Autonomous Leadership in Five Years
Fair Value SEK 438.80|39.7% undervalued
UN
Community Contributor