
Advertisement
Be Wary Of Triveni Engineering & Industries (NSE:TRIVENI) And Its Returns On Capital
Did you know there are some financial metrics that can provide clues of a potential multi-bagger? Firstly, we'd want to identify a growing return on capital employed (ROCE) and then alongside that, an ever-increasing base of capital employed. Basically this means that a company has profitable initiatives that it can continue to reinvest in, which is a trait of a compounding machine. However, after investigating Triveni Engineering & Industries (NSE:TRIVENI), we don't think it's current trends fit the mold of a multi-bagger.
Our free stock report includes 2 warning signs investors should be aware of before investing in Triveni Engineering & Industries. Read for free now.Return On Capital Employed (ROCE): What Is It?
For those who don't know, ROCE is a measure of a company's yearly pre-tax profit (its return), relative to the capital employed in the business. The formula for this calculation on Triveni Engineering & Industries is:
Return on Capital Employed = Earnings Before Interest and Tax (EBIT) ÷ (Total Assets - Current Liabilities)
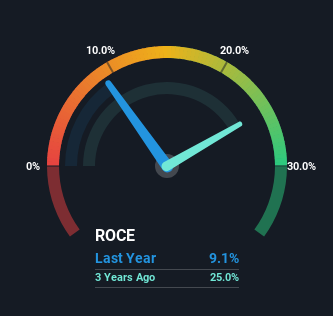
0.091 = ₹3.0b ÷ (₹42b - ₹9.6b) (Based on the trailing twelve months to December 2024).
Thus, Triveni Engineering & Industries has an ROCE of 9.1%. Ultimately, that's a low return and it under-performs the Food industry average of 13%.
See our latest analysis for Triveni Engineering & Industries
Above you can see how the current ROCE for Triveni Engineering & Industries compares to its prior returns on capital, but there's only so much you can tell from the past. If you're interested, you can view the analysts predictions in our free analyst report for Triveni Engineering & Industries .
What The Trend Of ROCE Can Tell Us
When we looked at the ROCE trend at Triveni Engineering & Industries, we didn't gain much confidence. Over the last five years, returns on capital have decreased to 9.1% from 22% five years ago. On the other hand, the company has been employing more capital without a corresponding improvement in sales in the last year, which could suggest these investments are longer term plays. It's worth keeping an eye on the company's earnings from here on to see if these investments do end up contributing to the bottom line.
On a side note, Triveni Engineering & Industries has done well to pay down its current liabilities to 23% of total assets. That could partly explain why the ROCE has dropped. Effectively this means their suppliers or short-term creditors are funding less of the business, which reduces some elements of risk. Since the business is basically funding more of its operations with it's own money, you could argue this has made the business less efficient at generating ROCE.
The Bottom Line
To conclude, we've found that Triveni Engineering & Industries is reinvesting in the business, but returns have been falling. Yet to long term shareholders the stock has gifted them an incredible 995% return in the last five years, so the market appears to be rosy about its future. But if the trajectory of these underlying trends continue, we think the likelihood of it being a multi-bagger from here isn't high.
Like most companies, Triveni Engineering & Industries does come with some risks, and we've found 2 warning signs that you should be aware of.
While Triveni Engineering & Industries isn't earning the highest return, check out this free list of companies that are earning high returns on equity with solid balance sheets.
Valuation is complex, but we're here to simplify it.
Discover if Triveni Engineering & Industries might be undervalued or overvalued with our detailed analysis, featuring fair value estimates, potential risks, dividends, insider trades, and its financial condition.
Access Free AnalysisHave feedback on this article? Concerned about the content? Get in touch with us directly. Alternatively, email editorial-team (at) simplywallst.com.
This article by Simply Wall St is general in nature. We provide commentary based on historical data and analyst forecasts only using an unbiased methodology and our articles are not intended to be financial advice. It does not constitute a recommendation to buy or sell any stock, and does not take account of your objectives, or your financial situation. We aim to bring you long-term focused analysis driven by fundamental data. Note that our analysis may not factor in the latest price-sensitive company announcements or qualitative material. Simply Wall St has no position in any stocks mentioned.
About NSEI:TRIVENI
Triveni Engineering & Industries
Engages in the sugar and allied businesses, and engineering businesses in India and internationally.
Adequate balance sheet with moderate growth potential.
Similar Companies
Market Insights

Advertisement
Community Narratives
Finding The True Value Of A Logistics Powerhouse
Fair Value US$95.21|8.5% undervalued
NV
Community Contributor
Paradigm Biopharmaceuticals Will Lead Osteoarthritis Treatment with Zilosul's FDA Success
Fair Value AU$5.50|91.9% undervalued
AM
Community Contributor
Barrick Mining (ABX:CA): A Gold Hedge against a U.S. Shutdown
Fair Value CA$60.00|26.5% undervalued
GM
Community Contributor