
Advertisement
Take Care Before Jumping Onto ShreeOswal Seeds and Chemicals Limited (NSE:OSWALSEEDS) Even Though It's 29% Cheaper
Unfortunately for some shareholders, the ShreeOswal Seeds and Chemicals Limited (NSE:OSWALSEEDS) share price has dived 29% in the last thirty days, prolonging recent pain. The drop over the last 30 days has capped off a tough year for shareholders, with the share price down 46% in that time.
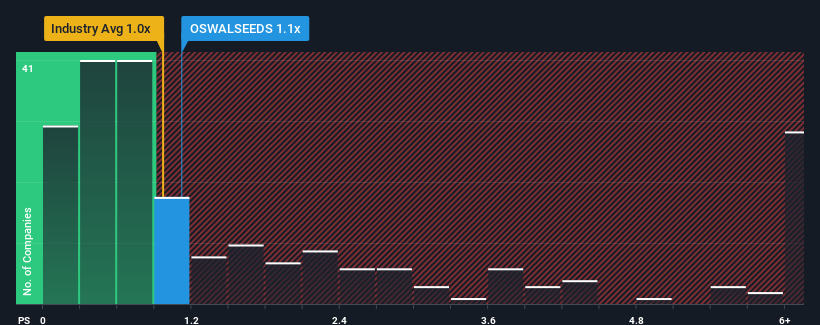
Even after such a large drop in price, you could still be forgiven for feeling indifferent about ShreeOswal Seeds and Chemicals' P/S ratio of 1.1x, since the median price-to-sales (or "P/S") ratio for the Food industry in India is also close to 1x. However, investors might be overlooking a clear opportunity or potential setback if there is no rational basis for the P/S.
Check out our latest analysis for ShreeOswal Seeds and Chemicals
How Has ShreeOswal Seeds and Chemicals Performed Recently?
As an illustration, revenue has deteriorated at ShreeOswal Seeds and Chemicals over the last year, which is not ideal at all. One possibility is that the P/S is moderate because investors think the company might still do enough to be in line with the broader industry in the near future. If not, then existing shareholders may be a little nervous about the viability of the share price.
Want the full picture on earnings, revenue and cash flow for the company? Then our free report on ShreeOswal Seeds and Chemicals will help you shine a light on its historical performance.What Are Revenue Growth Metrics Telling Us About The P/S?
The only time you'd be comfortable seeing a P/S like ShreeOswal Seeds and Chemicals' is when the company's growth is tracking the industry closely.
Taking a look back first, the company's revenue growth last year wasn't something to get excited about as it posted a disappointing decline of 15%. Still, the latest three year period has seen an excellent 58% overall rise in revenue, in spite of its unsatisfying short-term performance. Accordingly, while they would have preferred to keep the run going, shareholders would definitely welcome the medium-term rates of revenue growth.
When compared to the industry's one-year growth forecast of 12%, the most recent medium-term revenue trajectory is noticeably more alluring
With this information, we find it interesting that ShreeOswal Seeds and Chemicals is trading at a fairly similar P/S compared to the industry. Apparently some shareholders believe the recent performance is at its limits and have been accepting lower selling prices.
What Does ShreeOswal Seeds and Chemicals' P/S Mean For Investors?
With its share price dropping off a cliff, the P/S for ShreeOswal Seeds and Chemicals looks to be in line with the rest of the Food industry. Using the price-to-sales ratio alone to determine if you should sell your stock isn't sensible, however it can be a practical guide to the company's future prospects.
To our surprise, ShreeOswal Seeds and Chemicals revealed its three-year revenue trends aren't contributing to its P/S as much as we would have predicted, given they look better than current industry expectations. It'd be fair to assume that potential risks the company faces could be the contributing factor to the lower than expected P/S. It appears some are indeed anticipating revenue instability, because the persistence of these recent medium-term conditions would normally provide a boost to the share price.
Don't forget that there may be other risks. For instance, we've identified 2 warning signs for ShreeOswal Seeds and Chemicals (1 is significant) you should be aware of.
Of course, profitable companies with a history of great earnings growth are generally safer bets. So you may wish to see this free collection of other companies that have reasonable P/E ratios and have grown earnings strongly.
New: Manage All Your Stock Portfolios in One Place
We've created the ultimate portfolio companion for stock investors, and it's free.
• Connect an unlimited number of Portfolios and see your total in one currency
• Be alerted to new Warning Signs or Risks via email or mobile
• Track the Fair Value of your stocks
Have feedback on this article? Concerned about the content? Get in touch with us directly. Alternatively, email editorial-team (at) simplywallst.com.
This article by Simply Wall St is general in nature. We provide commentary based on historical data and analyst forecasts only using an unbiased methodology and our articles are not intended to be financial advice. It does not constitute a recommendation to buy or sell any stock, and does not take account of your objectives, or your financial situation. We aim to bring you long-term focused analysis driven by fundamental data. Note that our analysis may not factor in the latest price-sensitive company announcements or qualitative material. Simply Wall St has no position in any stocks mentioned.
About NSEI:OSWALSEEDS
ShreeOswal Seeds and Chemicals
Produces, processes, trades, and sells various agricultural seeds in India.
Adequate balance sheet and fair value.
Similar Companies
Market Insights

Advertisement
Community Narratives
Groundbreaking therapies that could change the treatment landscape for PTSD, fibromyalgia, MS & Alzheimer’s
Fair Value US$6.20|82.7% undervalued
CM
Community Contributor
DigitalOcean Will Grow 14% by Embracing AI with Paperspace Acquisition
Fair Value US$50.00|36.8% undervalued
NE
Community Contributor
Viant Technology: A Rising AdTech Challenger in the AI-Powered CTV Market
Fair Value US$38.61|61.4% undervalued
BL
Community Contributor
Volvo will Accelerate Forward into Electric and Autonomous Leadership in Five Years
Fair Value SEK 438.80|37.1% undervalued
UN
Community Contributor