The Bombay Burmah Trading Corporation, Limited's (NSE:BBTC) 31% Price Boost Is Out Of Tune With Revenues


The Bombay Burmah Trading Corporation, Limited (NSE:BBTC) shareholders have had their patience rewarded with a 31% share price jump in the last month. The last 30 days bring the annual gain to a very sharp 96%.
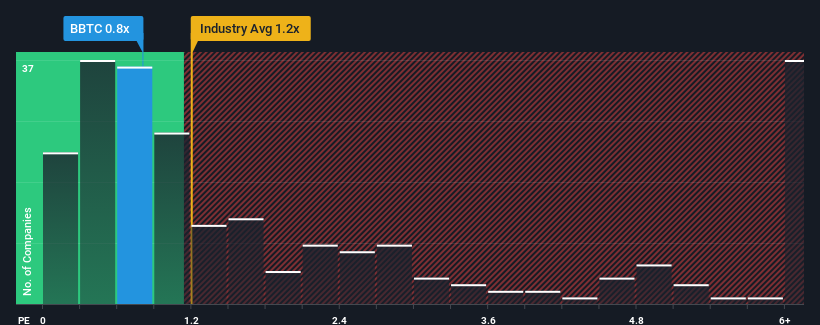
Even after such a large jump in price, you could still be forgiven for feeling indifferent about Bombay Burmah Trading Corporation's P/S ratio of 0.8x, since the median price-to-sales (or "P/S") ratio for the Food industry in India is also close to 1.2x. However, investors might be overlooking a clear opportunity or potential setback if there is no rational basis for the P/S.
View our latest analysis for Bombay Burmah Trading Corporation
What Does Bombay Burmah Trading Corporation's P/S Mean For Shareholders?
The recent revenue growth at Bombay Burmah Trading Corporation would have to be considered satisfactory if not spectacular. One possibility is that the P/S is moderate because investors think this good revenue growth might only be parallel to the broader industry in the near future. If you like the company, you'd be hoping this isn't the case so that you could potentially pick up some stock while it's not quite in favour.
Although there are no analyst estimates available for Bombay Burmah Trading Corporation, take a look at this free data-rich visualisation to see how the company stacks up on earnings, revenue and cash flow.What Are Revenue Growth Metrics Telling Us About The P/S?
There's an inherent assumption that a company should be matching the industry for P/S ratios like Bombay Burmah Trading Corporation's to be considered reasonable.
Retrospectively, the last year delivered a decent 3.5% gain to the company's revenues. Revenue has also lifted 28% in aggregate from three years ago, partly thanks to the last 12 months of growth. Therefore, it's fair to say the revenue growth recently has been respectable for the company.
Comparing the recent medium-term revenue trends against the industry's one-year growth forecast of 12% shows it's noticeably less attractive.
In light of this, it's curious that Bombay Burmah Trading Corporation's P/S sits in line with the majority of other companies. Apparently many investors in the company are less bearish than recent times would indicate and aren't willing to let go of their stock right now. Maintaining these prices will be difficult to achieve as a continuation of recent revenue trends is likely to weigh down the shares eventually.
The Final Word
Bombay Burmah Trading Corporation appears to be back in favour with a solid price jump bringing its P/S back in line with other companies in the industry Using the price-to-sales ratio alone to determine if you should sell your stock isn't sensible, however it can be a practical guide to the company's future prospects.
Our examination of Bombay Burmah Trading Corporation revealed its poor three-year revenue trends aren't resulting in a lower P/S as per our expectations, given they look worse than current industry outlook. Right now we are uncomfortable with the P/S as this revenue performance isn't likely to support a more positive sentiment for long. If recent medium-term revenue trends continue, the probability of a share price decline will become quite substantial, placing shareholders at risk.
We don't want to rain on the parade too much, but we did also find 1 warning sign for Bombay Burmah Trading Corporation that you need to be mindful of.
It's important to make sure you look for a great company, not just the first idea you come across. So if growing profitability aligns with your idea of a great company, take a peek at this free list of interesting companies with strong recent earnings growth (and a low P/E).
Valuation is complex, but we're here to simplify it.
Discover if Bombay Burmah Trading Corporation might be undervalued or overvalued with our detailed analysis, featuring fair value estimates, potential risks, dividends, insider trades, and its financial condition.
Access Free AnalysisHave feedback on this article? Concerned about the content? Get in touch with us directly. Alternatively, email editorial-team (at) simplywallst.com.
This article by Simply Wall St is general in nature. We provide commentary based on historical data and analyst forecasts only using an unbiased methodology and our articles are not intended to be financial advice. It does not constitute a recommendation to buy or sell any stock, and does not take account of your objectives, or your financial situation. We aim to bring you long-term focused analysis driven by fundamental data. Note that our analysis may not factor in the latest price-sensitive company announcements or qualitative material. Simply Wall St has no position in any stocks mentioned.
Have feedback on this article? Concerned about the content? Get in touch with us directly. Alternatively, email editorial-team@simplywallst.com
About NSEI:BBTC
Bombay Burmah Trading Corporation
Engages in the tea and coffee plantations, auto electric components, healthcare, and real estate businesses in India and internationally.
Undervalued with excellent balance sheet.
Market Insights

Community Narratives

